Spanish vs Maltese Disability Age 5 to 17
COMPARE
Spanish
Maltese
Disability Age 5 to 17
Disability Age 5 to 17 Comparison
Spanish
Maltese
6.0%
DISABILITY AGE 5 TO 17
0.5/ 100
METRIC RATING
267th/ 347
METRIC RANK
5.4%
DISABILITY AGE 5 TO 17
96.0/ 100
METRIC RATING
121st/ 347
METRIC RANK
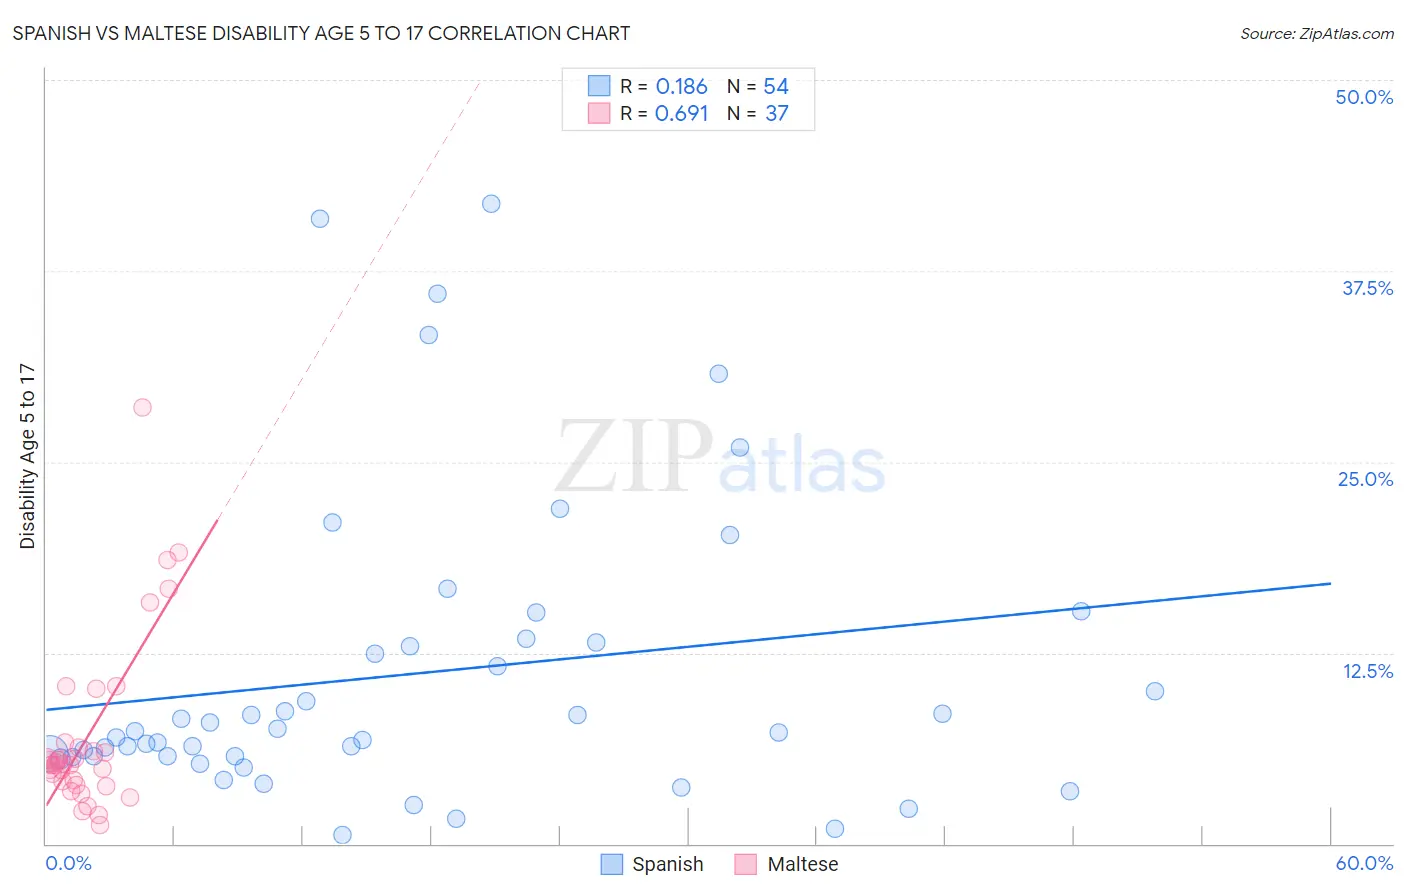
Spanish vs Maltese Disability Age 5 to 17 Correlation Chart
The statistical analysis conducted on geographies consisting of 418,244,761 people shows a poor positive correlation between the proportion of Spanish and percentage of population with a disability between the ages 5 and 17 in the United States with a correlation coefficient (R) of 0.186 and weighted average of 6.0%. Similarly, the statistical analysis conducted on geographies consisting of 125,822,191 people shows a significant positive correlation between the proportion of Maltese and percentage of population with a disability between the ages 5 and 17 in the United States with a correlation coefficient (R) of 0.691 and weighted average of 5.4%, a difference of 10.9%.
Disability Age 5 to 17 Correlation Summary
| Measurement | Spanish | Maltese |
| Minimum | 0.61% | 1.3% |
| Maximum | 41.9% | 28.6% |
| Range | 41.3% | 27.3% |
| Mean | 11.1% | 7.0% |
| Median | 7.3% | 5.2% |
| Interquartile 25% (IQ1) | 5.7% | 4.0% |
| Interquartile 75% (IQ3) | 13.2% | 6.4% |
| Interquartile Range (IQR) | 7.5% | 2.5% |
| Standard Deviation (Sample) | 9.8% | 5.7% |
| Standard Deviation (Population) | 9.8% | 5.6% |
Similar Demographics by Disability Age 5 to 17
Demographics Similar to Spanish by Disability Age 5 to 17
In terms of disability age 5 to 17, the demographic groups most similar to Spanish are Slovene (6.0%, a difference of 0.11%), Panamanian (6.0%, a difference of 0.13%), Sioux (6.0%, a difference of 0.19%), Canadian (6.0%, a difference of 0.21%), and Liberian (6.0%, a difference of 0.22%).
| Demographics | Rating | Rank | Disability Age 5 to 17 |
| Somalis | 0.8 /100 | #260 | Tragic 5.9% |
| Immigrants | Middle Africa | 0.7 /100 | #261 | Tragic 5.9% |
| Immigrants | Western Africa | 0.7 /100 | #262 | Tragic 5.9% |
| Czechoslovakians | 0.7 /100 | #263 | Tragic 5.9% |
| Canadians | 0.6 /100 | #264 | Tragic 6.0% |
| Panamanians | 0.6 /100 | #265 | Tragic 6.0% |
| Slovenes | 0.6 /100 | #266 | Tragic 6.0% |
| Spanish | 0.5 /100 | #267 | Tragic 6.0% |
| Sioux | 0.4 /100 | #268 | Tragic 6.0% |
| Liberians | 0.4 /100 | #269 | Tragic 6.0% |
| Immigrants | Somalia | 0.4 /100 | #270 | Tragic 6.0% |
| Immigrants | Zaire | 0.2 /100 | #271 | Tragic 6.0% |
| Finns | 0.2 /100 | #272 | Tragic 6.0% |
| Alaska Natives | 0.2 /100 | #273 | Tragic 6.0% |
| Cheyenne | 0.2 /100 | #274 | Tragic 6.0% |
Demographics Similar to Maltese by Disability Age 5 to 17
In terms of disability age 5 to 17, the demographic groups most similar to Maltese are Chilean (5.4%, a difference of 0.060%), Immigrants from Ethiopia (5.4%, a difference of 0.16%), Crow (5.4%, a difference of 0.29%), Immigrants from Chile (5.4%, a difference of 0.30%), and New Zealander (5.4%, a difference of 0.31%).
| Demographics | Rating | Rank | Disability Age 5 to 17 |
| Immigrants | Northern Europe | 97.8 /100 | #114 | Exceptional 5.3% |
| Cubans | 97.8 /100 | #115 | Exceptional 5.3% |
| Cypriots | 97.7 /100 | #116 | Exceptional 5.3% |
| Immigrants | Afghanistan | 97.4 /100 | #117 | Exceptional 5.3% |
| South Americans | 97.1 /100 | #118 | Exceptional 5.4% |
| Immigrants | South America | 97.1 /100 | #119 | Exceptional 5.4% |
| Immigrants | Immigrants | 97.0 /100 | #120 | Exceptional 5.4% |
| Maltese | 96.0 /100 | #121 | Exceptional 5.4% |
| Chileans | 95.8 /100 | #122 | Exceptional 5.4% |
| Immigrants | Ethiopia | 95.5 /100 | #123 | Exceptional 5.4% |
| Crow | 95.0 /100 | #124 | Exceptional 5.4% |
| Immigrants | Chile | 95.0 /100 | #125 | Exceptional 5.4% |
| New Zealanders | 95.0 /100 | #126 | Exceptional 5.4% |
| Latvians | 95.0 /100 | #127 | Exceptional 5.4% |
| Immigrants | Venezuela | 94.5 /100 | #128 | Exceptional 5.4% |