West Indian vs Immigrants from Barbados Disability Age Under 5
COMPARE
West Indian
Immigrants from Barbados
Disability Age Under 5
Disability Age Under 5 Comparison
West Indians
Immigrants from Barbados
1.1%
DISABILITY AGE UNDER 5
98.0/ 100
METRIC RATING
78th/ 347
METRIC RANK
0.97%
DISABILITY AGE UNDER 5
100.0/ 100
METRIC RATING
18th/ 347
METRIC RANK
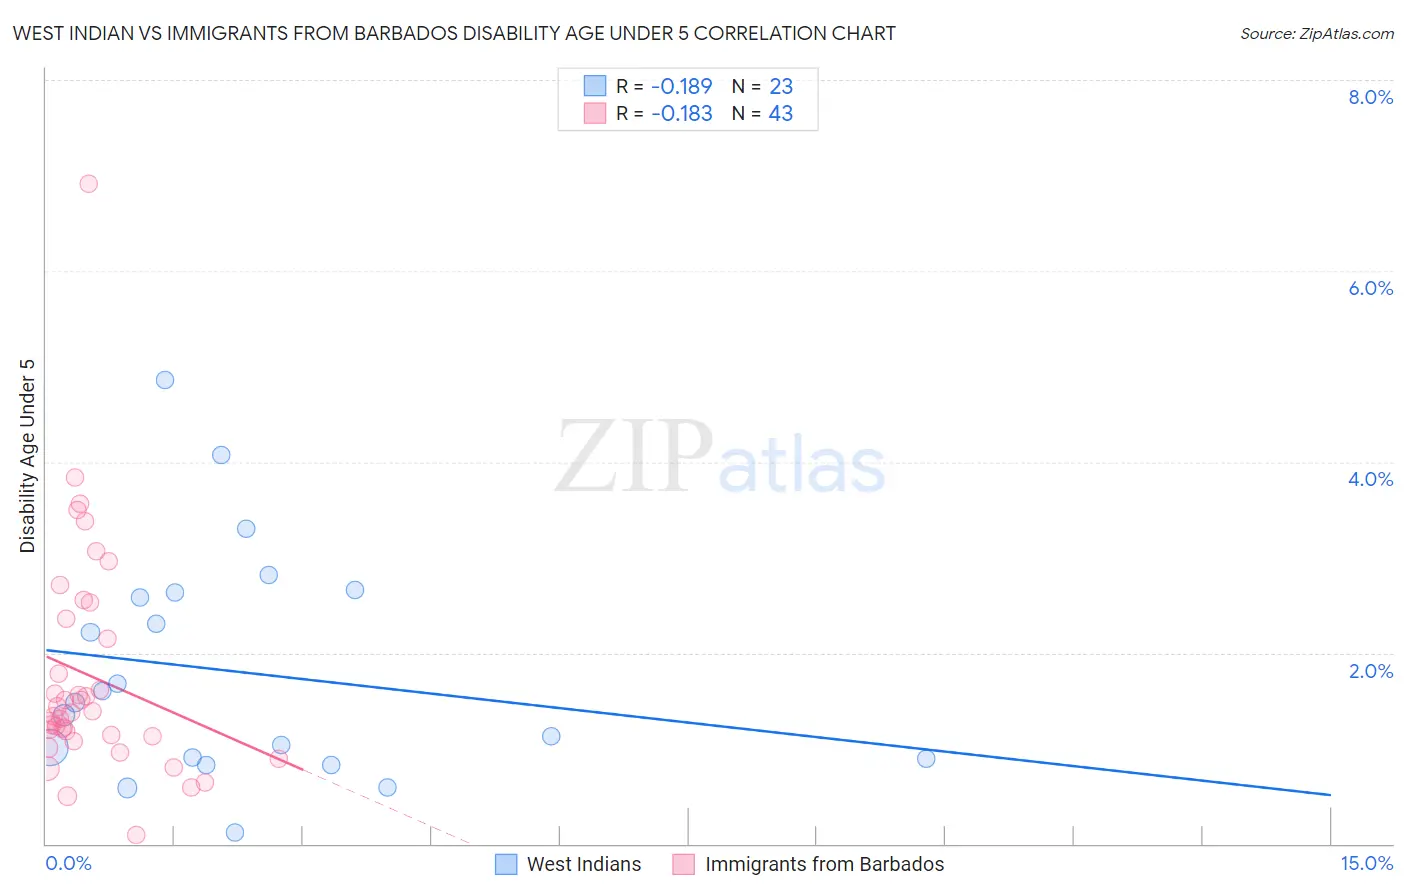
West Indian vs Immigrants from Barbados Disability Age Under 5 Correlation Chart
The statistical analysis conducted on geographies consisting of 157,728,893 people shows a poor negative correlation between the proportion of West Indians and percentage of population with a disability under the age of 5 in the United States with a correlation coefficient (R) of -0.189 and weighted average of 1.1%. Similarly, the statistical analysis conducted on geographies consisting of 80,516,356 people shows a poor negative correlation between the proportion of Immigrants from Barbados and percentage of population with a disability under the age of 5 in the United States with a correlation coefficient (R) of -0.183 and weighted average of 0.97%, a difference of 16.7%.
Disability Age Under 5 Correlation Summary
| Measurement | West Indian | Immigrants from Barbados |
| Minimum | 0.12% | 0.086% |
| Maximum | 4.9% | 6.9% |
| Range | 4.7% | 6.8% |
| Mean | 1.8% | 1.8% |
| Median | 1.5% | 1.4% |
| Interquartile 25% (IQ1) | 0.89% | 1.1% |
| Interquartile 75% (IQ3) | 2.6% | 2.4% |
| Interquartile Range (IQR) | 1.7% | 1.2% |
| Standard Deviation (Sample) | 1.2% | 1.2% |
| Standard Deviation (Population) | 1.2% | 1.2% |
Similar Demographics by Disability Age Under 5
Demographics Similar to West Indians by Disability Age Under 5
In terms of disability age under 5, the demographic groups most similar to West Indians are Hmong (1.1%, a difference of 0.020%), Immigrants from Trinidad and Tobago (1.1%, a difference of 0.040%), Turkish (1.1%, a difference of 0.060%), Immigrants from Denmark (1.1%, a difference of 0.12%), and Immigrants from Jordan (1.1%, a difference of 0.18%).
| Demographics | Rating | Rank | Disability Age Under 5 |
| Trinidadians and Tobagonians | 98.6 /100 | #71 | Exceptional 1.1% |
| Burmese | 98.5 /100 | #72 | Exceptional 1.1% |
| Immigrants | Sri Lanka | 98.5 /100 | #73 | Exceptional 1.1% |
| Jordanians | 98.5 /100 | #74 | Exceptional 1.1% |
| Immigrants | Pakistan | 98.4 /100 | #75 | Exceptional 1.1% |
| Immigrants | Burma/Myanmar | 98.2 /100 | #76 | Exceptional 1.1% |
| Immigrants | Denmark | 98.1 /100 | #77 | Exceptional 1.1% |
| West Indians | 98.0 /100 | #78 | Exceptional 1.1% |
| Hmong | 98.0 /100 | #79 | Exceptional 1.1% |
| Immigrants | Trinidad and Tobago | 98.0 /100 | #80 | Exceptional 1.1% |
| Turks | 98.0 /100 | #81 | Exceptional 1.1% |
| Immigrants | Jordan | 97.9 /100 | #82 | Exceptional 1.1% |
| Immigrants | Syria | 97.9 /100 | #83 | Exceptional 1.1% |
| Immigrants | Zaire | 97.8 /100 | #84 | Exceptional 1.1% |
| Sudanese | 97.7 /100 | #85 | Exceptional 1.1% |
Demographics Similar to Immigrants from Barbados by Disability Age Under 5
In terms of disability age under 5, the demographic groups most similar to Immigrants from Barbados are Puget Sound Salish (0.97%, a difference of 0.37%), Nepalese (0.97%, a difference of 0.47%), Immigrants from China (0.96%, a difference of 0.58%), Immigrants from Israel (0.96%, a difference of 1.0%), and Immigrants from Hong Kong (0.95%, a difference of 2.3%).
| Demographics | Rating | Rank | Disability Age Under 5 |
| Afghans | 100.0 /100 | #11 | Exceptional 0.94% |
| Immigrants | Grenada | 100.0 /100 | #12 | Exceptional 0.94% |
| Soviet Union | 100.0 /100 | #13 | Exceptional 0.95% |
| Yuman | 100.0 /100 | #14 | Exceptional 0.95% |
| Immigrants | Hong Kong | 100.0 /100 | #15 | Exceptional 0.95% |
| Immigrants | Israel | 100.0 /100 | #16 | Exceptional 0.96% |
| Immigrants | China | 100.0 /100 | #17 | Exceptional 0.96% |
| Immigrants | Barbados | 100.0 /100 | #18 | Exceptional 0.97% |
| Puget Sound Salish | 100.0 /100 | #19 | Exceptional 0.97% |
| Nepalese | 100.0 /100 | #20 | Exceptional 0.97% |
| British West Indians | 100.0 /100 | #21 | Exceptional 0.99% |
| Immigrants | Iran | 100.0 /100 | #22 | Exceptional 1.00% |
| Yakama | 100.0 /100 | #23 | Exceptional 1.00% |
| Indians (Asian) | 100.0 /100 | #24 | Exceptional 1.0% |
| Immigrants | Micronesia | 100.0 /100 | #25 | Exceptional 1.0% |