Immigrants from Chile vs Immigrants from Barbados Disability Age Under 5
COMPARE
Immigrants from Chile
Immigrants from Barbados
Disability Age Under 5
Disability Age Under 5 Comparison
Immigrants from Chile
Immigrants from Barbados
1.3%
DISABILITY AGE UNDER 5
17.2/ 100
METRIC RATING
214th/ 347
METRIC RANK
0.97%
DISABILITY AGE UNDER 5
100.0/ 100
METRIC RATING
18th/ 347
METRIC RANK
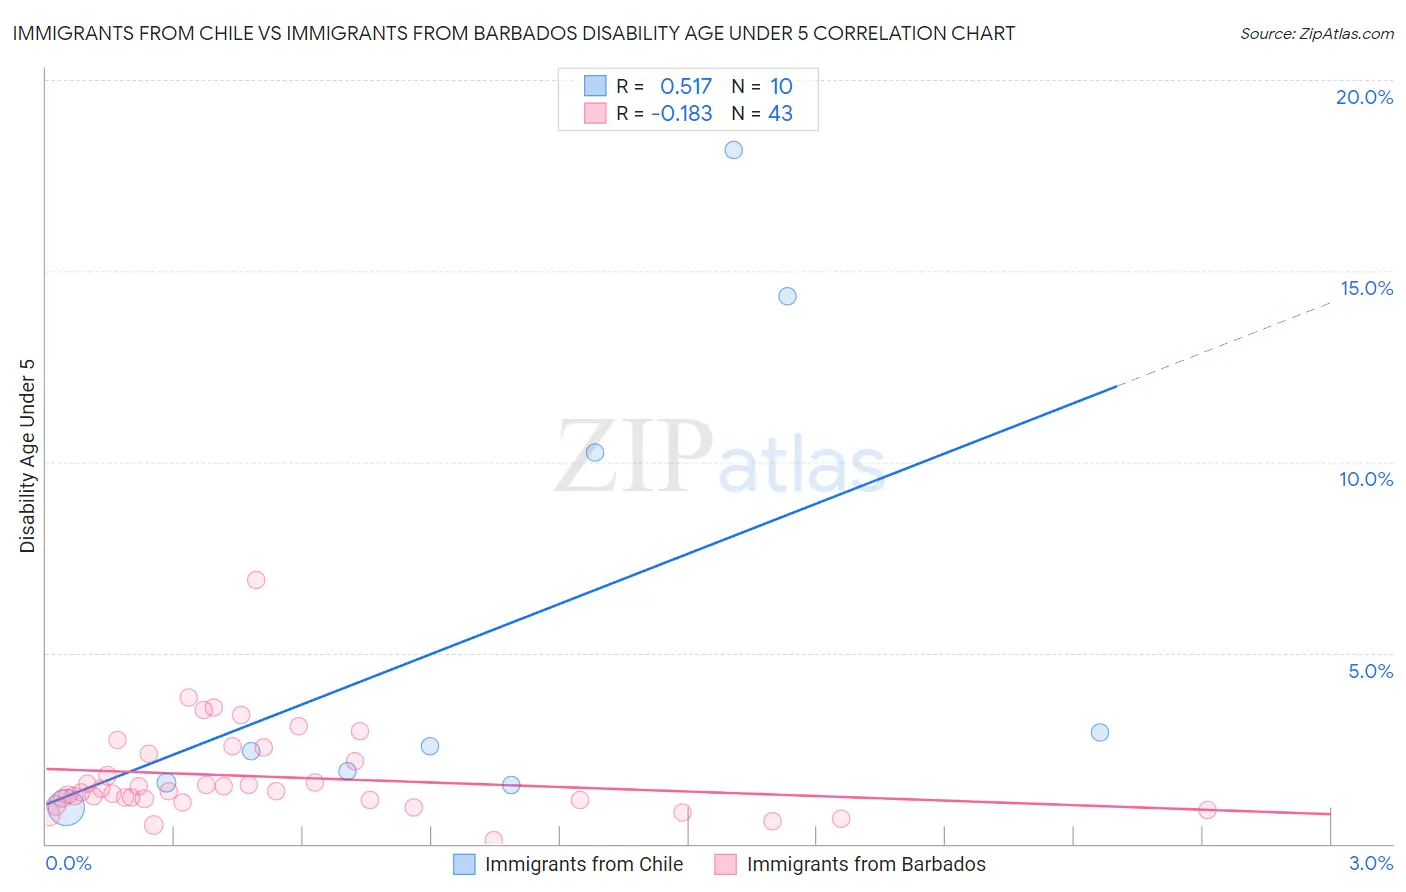
Immigrants from Chile vs Immigrants from Barbados Disability Age Under 5 Correlation Chart
The statistical analysis conducted on geographies consisting of 142,107,365 people shows a substantial positive correlation between the proportion of Immigrants from Chile and percentage of population with a disability under the age of 5 in the United States with a correlation coefficient (R) of 0.517 and weighted average of 1.3%. Similarly, the statistical analysis conducted on geographies consisting of 80,516,356 people shows a poor negative correlation between the proportion of Immigrants from Barbados and percentage of population with a disability under the age of 5 in the United States with a correlation coefficient (R) of -0.183 and weighted average of 0.97%, a difference of 32.6%.
Disability Age Under 5 Correlation Summary
| Measurement | Immigrants from Chile | Immigrants from Barbados |
| Minimum | 0.94% | 0.086% |
| Maximum | 18.2% | 6.9% |
| Range | 17.2% | 6.8% |
| Mean | 5.7% | 1.8% |
| Median | 2.5% | 1.4% |
| Interquartile 25% (IQ1) | 1.6% | 1.1% |
| Interquartile 75% (IQ3) | 10.2% | 2.4% |
| Interquartile Range (IQR) | 8.6% | 1.2% |
| Standard Deviation (Sample) | 6.2% | 1.2% |
| Standard Deviation (Population) | 5.9% | 1.2% |
Similar Demographics by Disability Age Under 5
Demographics Similar to Immigrants from Chile by Disability Age Under 5
In terms of disability age under 5, the demographic groups most similar to Immigrants from Chile are Syrian (1.3%, a difference of 0.17%), Immigrants from Sudan (1.3%, a difference of 0.23%), Chilean (1.3%, a difference of 0.24%), Bangladeshi (1.3%, a difference of 0.27%), and Immigrants from Greece (1.3%, a difference of 0.29%).
| Demographics | Rating | Rank | Disability Age Under 5 |
| Nigerians | 21.2 /100 | #207 | Fair 1.3% |
| Mexicans | 20.8 /100 | #208 | Fair 1.3% |
| Bulgarians | 19.5 /100 | #209 | Poor 1.3% |
| Pakistanis | 19.4 /100 | #210 | Poor 1.3% |
| Immigrants | Greece | 19.1 /100 | #211 | Poor 1.3% |
| Chileans | 18.8 /100 | #212 | Poor 1.3% |
| Immigrants | Sudan | 18.7 /100 | #213 | Poor 1.3% |
| Immigrants | Chile | 17.2 /100 | #214 | Poor 1.3% |
| Syrians | 16.1 /100 | #215 | Poor 1.3% |
| Bangladeshis | 15.5 /100 | #216 | Poor 1.3% |
| Cypriots | 14.9 /100 | #217 | Poor 1.3% |
| Malaysians | 13.2 /100 | #218 | Poor 1.3% |
| Immigrants | Croatia | 11.2 /100 | #219 | Poor 1.3% |
| Serbians | 9.6 /100 | #220 | Tragic 1.3% |
| Sub-Saharan Africans | 8.3 /100 | #221 | Tragic 1.3% |
Demographics Similar to Immigrants from Barbados by Disability Age Under 5
In terms of disability age under 5, the demographic groups most similar to Immigrants from Barbados are Puget Sound Salish (0.97%, a difference of 0.37%), Nepalese (0.97%, a difference of 0.47%), Immigrants from China (0.96%, a difference of 0.58%), Immigrants from Israel (0.96%, a difference of 1.0%), and Immigrants from Hong Kong (0.95%, a difference of 2.3%).
| Demographics | Rating | Rank | Disability Age Under 5 |
| Afghans | 100.0 /100 | #11 | Exceptional 0.94% |
| Immigrants | Grenada | 100.0 /100 | #12 | Exceptional 0.94% |
| Soviet Union | 100.0 /100 | #13 | Exceptional 0.95% |
| Yuman | 100.0 /100 | #14 | Exceptional 0.95% |
| Immigrants | Hong Kong | 100.0 /100 | #15 | Exceptional 0.95% |
| Immigrants | Israel | 100.0 /100 | #16 | Exceptional 0.96% |
| Immigrants | China | 100.0 /100 | #17 | Exceptional 0.96% |
| Immigrants | Barbados | 100.0 /100 | #18 | Exceptional 0.97% |
| Puget Sound Salish | 100.0 /100 | #19 | Exceptional 0.97% |
| Nepalese | 100.0 /100 | #20 | Exceptional 0.97% |
| British West Indians | 100.0 /100 | #21 | Exceptional 0.99% |
| Immigrants | Iran | 100.0 /100 | #22 | Exceptional 1.00% |
| Yakama | 100.0 /100 | #23 | Exceptional 1.00% |
| Indians (Asian) | 100.0 /100 | #24 | Exceptional 1.0% |
| Immigrants | Micronesia | 100.0 /100 | #25 | Exceptional 1.0% |