French Canadian vs Mongolian Ambulatory Disability
COMPARE
French Canadian
Mongolian
Ambulatory Disability
Ambulatory Disability Comparison
French Canadians
Mongolians
6.7%
AMBULATORY DISABILITY
0.1/ 100
METRIC RATING
272nd/ 347
METRIC RANK
5.5%
AMBULATORY DISABILITY
99.9/ 100
METRIC RATING
41st/ 347
METRIC RANK
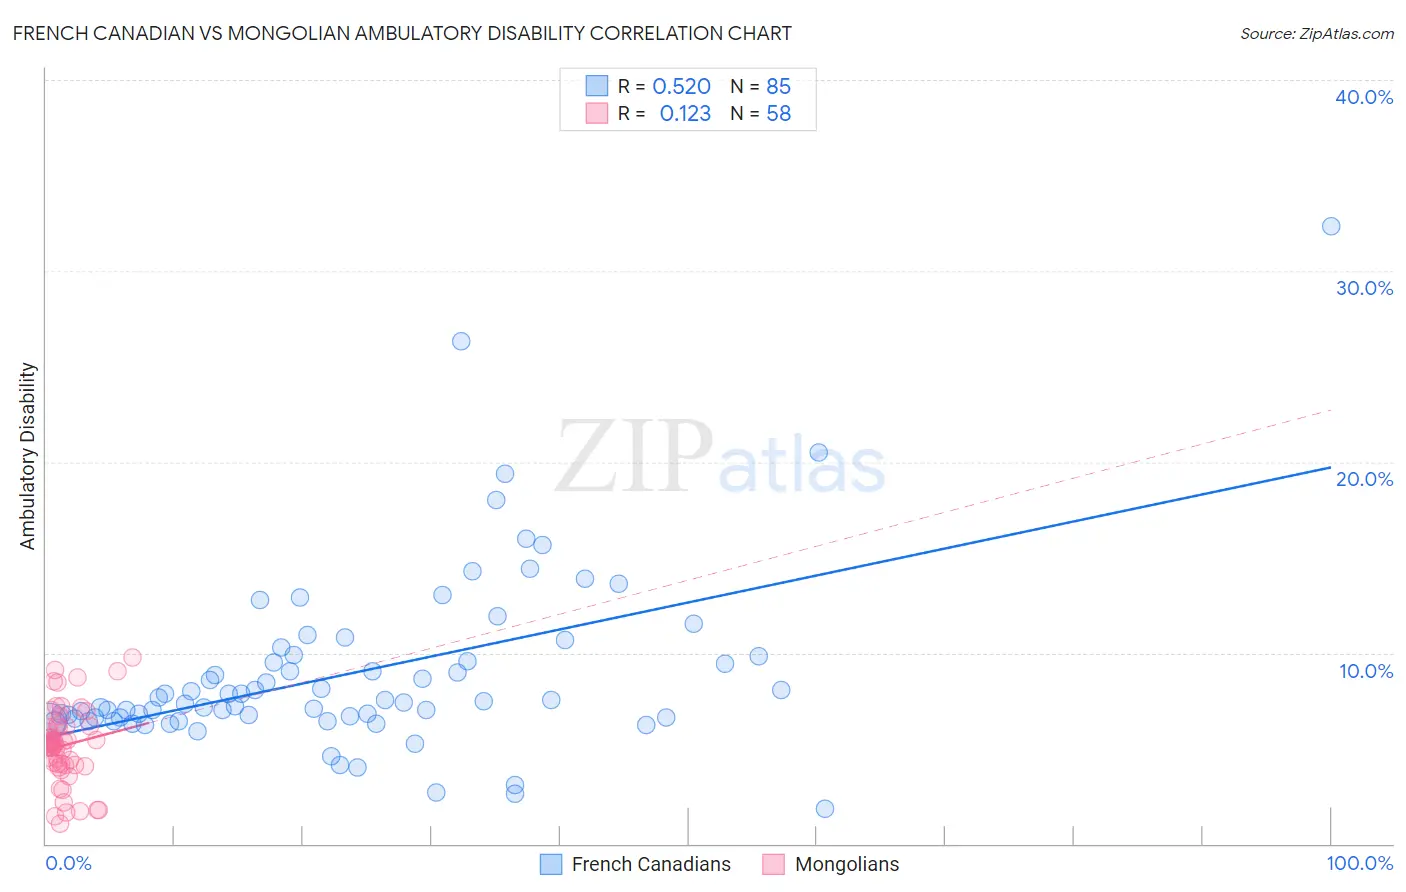
French Canadian vs Mongolian Ambulatory Disability Correlation Chart
The statistical analysis conducted on geographies consisting of 502,380,239 people shows a substantial positive correlation between the proportion of French Canadians and percentage of population with ambulatory disability in the United States with a correlation coefficient (R) of 0.520 and weighted average of 6.7%. Similarly, the statistical analysis conducted on geographies consisting of 140,347,726 people shows a poor positive correlation between the proportion of Mongolians and percentage of population with ambulatory disability in the United States with a correlation coefficient (R) of 0.123 and weighted average of 5.5%, a difference of 21.5%.
Ambulatory Disability Correlation Summary
| Measurement | French Canadian | Mongolian |
| Minimum | 1.8% | 1.0% |
| Maximum | 32.4% | 9.8% |
| Range | 30.5% | 8.7% |
| Mean | 9.0% | 5.2% |
| Median | 7.4% | 5.2% |
| Interquartile 25% (IQ1) | 6.6% | 4.1% |
| Interquartile 75% (IQ3) | 9.9% | 6.1% |
| Interquartile Range (IQR) | 3.3% | 2.0% |
| Standard Deviation (Sample) | 4.7% | 2.0% |
| Standard Deviation (Population) | 4.7% | 2.0% |
Similar Demographics by Ambulatory Disability
Demographics Similar to French Canadians by Ambulatory Disability
In terms of ambulatory disability, the demographic groups most similar to French Canadians are White/Caucasian (6.7%, a difference of 0.020%), Sioux (6.7%, a difference of 0.26%), Immigrants from Guyana (6.7%, a difference of 0.32%), Celtic (6.7%, a difference of 0.35%), and Immigrants from Trinidad and Tobago (6.7%, a difference of 0.36%).
| Demographics | Rating | Rank | Ambulatory Disability |
| Bahamians | 0.2 /100 | #265 | Tragic 6.6% |
| Guyanese | 0.2 /100 | #266 | Tragic 6.6% |
| Trinidadians and Tobagonians | 0.2 /100 | #267 | Tragic 6.6% |
| Spanish | 0.2 /100 | #268 | Tragic 6.6% |
| French | 0.1 /100 | #269 | Tragic 6.6% |
| Slovaks | 0.1 /100 | #270 | Tragic 6.7% |
| Immigrants | Trinidad and Tobago | 0.1 /100 | #271 | Tragic 6.7% |
| French Canadians | 0.1 /100 | #272 | Tragic 6.7% |
| Whites/Caucasians | 0.1 /100 | #273 | Tragic 6.7% |
| Sioux | 0.1 /100 | #274 | Tragic 6.7% |
| Immigrants | Guyana | 0.1 /100 | #275 | Tragic 6.7% |
| Celtics | 0.1 /100 | #276 | Tragic 6.7% |
| Jamaicans | 0.1 /100 | #277 | Tragic 6.7% |
| Immigrants | West Indies | 0.1 /100 | #278 | Tragic 6.7% |
| Immigrants | Caribbean | 0.0 /100 | #279 | Tragic 6.7% |
Demographics Similar to Mongolians by Ambulatory Disability
In terms of ambulatory disability, the demographic groups most similar to Mongolians are Venezuelan (5.5%, a difference of 0.080%), Argentinean (5.5%, a difference of 0.080%), Immigrants from Eritrea (5.5%, a difference of 0.42%), Turkish (5.5%, a difference of 0.51%), and Cypriot (5.5%, a difference of 0.51%).
| Demographics | Rating | Rank | Ambulatory Disability |
| Immigrants | Asia | 100.0 /100 | #34 | Exceptional 5.5% |
| Afghans | 100.0 /100 | #35 | Exceptional 5.5% |
| Immigrants | Malaysia | 100.0 /100 | #36 | Exceptional 5.5% |
| Turks | 100.0 /100 | #37 | Exceptional 5.5% |
| Cypriots | 100.0 /100 | #38 | Exceptional 5.5% |
| Immigrants | Eritrea | 100.0 /100 | #39 | Exceptional 5.5% |
| Venezuelans | 99.9 /100 | #40 | Exceptional 5.5% |
| Mongolians | 99.9 /100 | #41 | Exceptional 5.5% |
| Argentineans | 99.9 /100 | #42 | Exceptional 5.5% |
| Paraguayans | 99.9 /100 | #43 | Exceptional 5.5% |
| Immigrants | Indonesia | 99.9 /100 | #44 | Exceptional 5.5% |
| Immigrants | Sweden | 99.9 /100 | #45 | Exceptional 5.6% |
| Egyptians | 99.9 /100 | #46 | Exceptional 5.6% |
| Immigrants | Japan | 99.9 /100 | #47 | Exceptional 5.6% |
| Immigrants | Argentina | 99.9 /100 | #48 | Exceptional 5.6% |