Finnish vs Swiss Self-Care Disability
COMPARE
Finnish
Swiss
Self-Care Disability
Self-Care Disability Comparison
Finns
Swiss
2.4%
SELF-CARE DISABILITY
67.0/ 100
METRIC RATING
160th/ 347
METRIC RANK
2.4%
SELF-CARE DISABILITY
96.6/ 100
METRIC RATING
97th/ 347
METRIC RANK
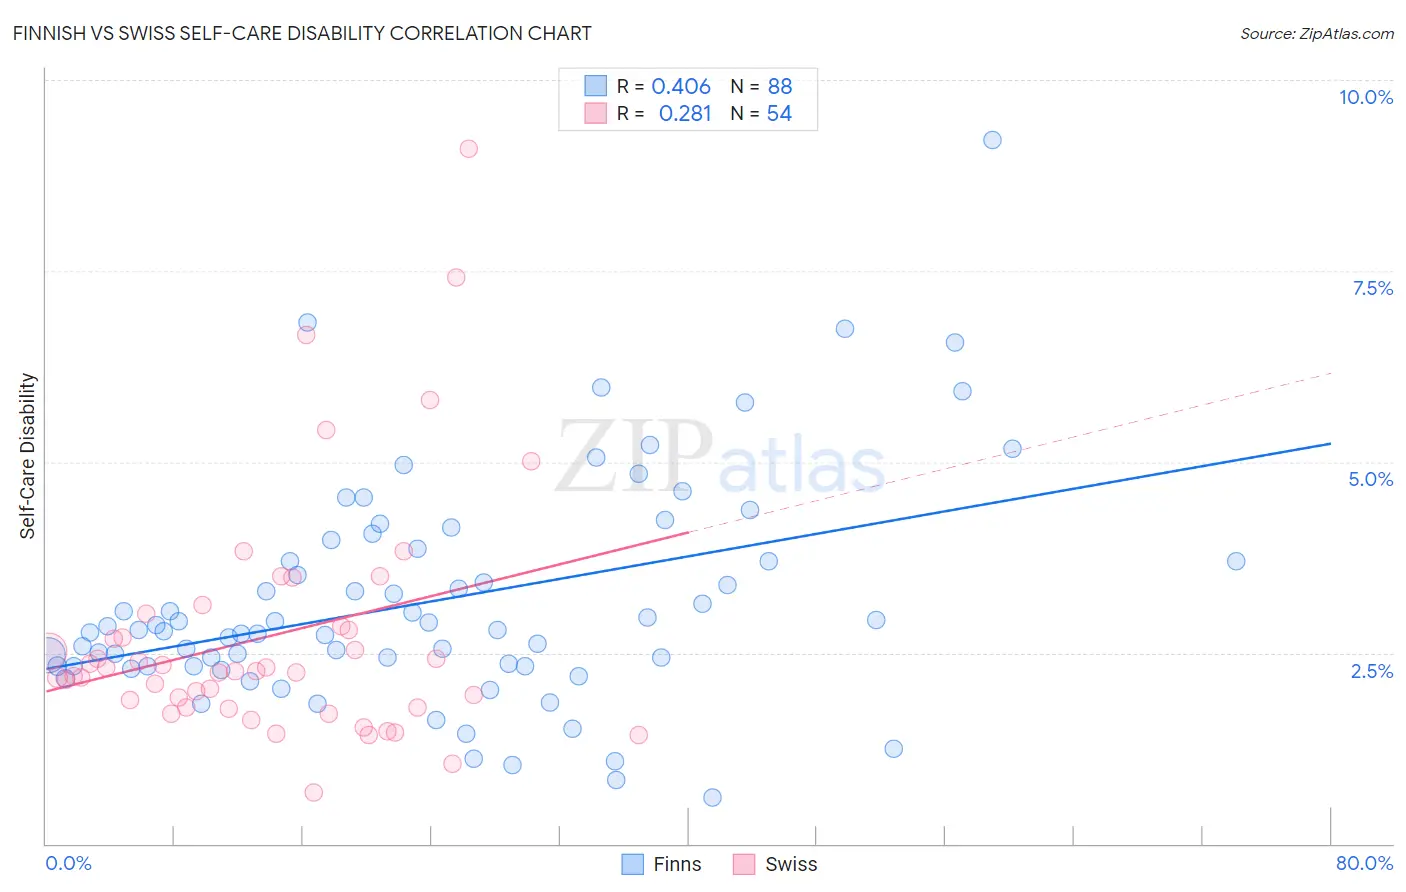
Finnish vs Swiss Self-Care Disability Correlation Chart
The statistical analysis conducted on geographies consisting of 404,111,559 people shows a moderate positive correlation between the proportion of Finns and percentage of population with self-care disability in the United States with a correlation coefficient (R) of 0.406 and weighted average of 2.4%. Similarly, the statistical analysis conducted on geographies consisting of 464,154,677 people shows a weak positive correlation between the proportion of Swiss and percentage of population with self-care disability in the United States with a correlation coefficient (R) of 0.281 and weighted average of 2.4%, a difference of 3.3%.
Self-Care Disability Correlation Summary
| Measurement | Finnish | Swiss |
| Minimum | 0.60% | 0.66% |
| Maximum | 9.2% | 9.1% |
| Range | 8.6% | 8.4% |
| Mean | 3.2% | 2.7% |
| Median | 2.8% | 2.3% |
| Interquartile 25% (IQ1) | 2.3% | 1.8% |
| Interquartile 75% (IQ3) | 3.8% | 2.9% |
| Interquartile Range (IQR) | 1.5% | 1.1% |
| Standard Deviation (Sample) | 1.5% | 1.6% |
| Standard Deviation (Population) | 1.5% | 1.6% |
Similar Demographics by Self-Care Disability
Demographics Similar to Finns by Self-Care Disability
In terms of self-care disability, the demographic groups most similar to Finns are Lebanese (2.4%, a difference of 0.030%), Immigrants from Italy (2.4%, a difference of 0.080%), Immigrants from Western Europe (2.4%, a difference of 0.090%), Immigrants from Europe (2.4%, a difference of 0.14%), and Somali (2.5%, a difference of 0.17%).
| Demographics | Rating | Rank | Self-Care Disability |
| Immigrants | England | 73.5 /100 | #153 | Good 2.4% |
| Italians | 72.2 /100 | #154 | Good 2.4% |
| Pakistanis | 71.4 /100 | #155 | Good 2.4% |
| Nigerians | 70.6 /100 | #156 | Good 2.4% |
| Immigrants | Europe | 69.6 /100 | #157 | Good 2.4% |
| Immigrants | Western Europe | 68.6 /100 | #158 | Good 2.4% |
| Immigrants | Italy | 68.5 /100 | #159 | Good 2.4% |
| Finns | 67.0 /100 | #160 | Good 2.4% |
| Lebanese | 66.5 /100 | #161 | Good 2.4% |
| Somalis | 63.7 /100 | #162 | Good 2.5% |
| German Russians | 62.7 /100 | #163 | Good 2.5% |
| Immigrants | Vietnam | 59.3 /100 | #164 | Average 2.5% |
| Syrians | 59.0 /100 | #165 | Average 2.5% |
| Canadians | 58.8 /100 | #166 | Average 2.5% |
| Immigrants | Greece | 57.3 /100 | #167 | Average 2.5% |
Demographics Similar to Swiss by Self-Care Disability
In terms of self-care disability, the demographic groups most similar to Swiss are Immigrants from Chile (2.4%, a difference of 0.040%), Immigrants from Poland (2.4%, a difference of 0.090%), Immigrants from Asia (2.4%, a difference of 0.10%), Macedonian (2.4%, a difference of 0.11%), and Immigrants from Latvia (2.4%, a difference of 0.16%).
| Demographics | Rating | Rank | Self-Care Disability |
| Immigrants | Czechoslovakia | 97.7 /100 | #90 | Exceptional 2.4% |
| Immigrants | Jordan | 97.7 /100 | #91 | Exceptional 2.4% |
| Icelanders | 97.4 /100 | #92 | Exceptional 2.4% |
| Immigrants | Latvia | 97.0 /100 | #93 | Exceptional 2.4% |
| Macedonians | 96.9 /100 | #94 | Exceptional 2.4% |
| Immigrants | Asia | 96.9 /100 | #95 | Exceptional 2.4% |
| Immigrants | Chile | 96.7 /100 | #96 | Exceptional 2.4% |
| Swiss | 96.6 /100 | #97 | Exceptional 2.4% |
| Immigrants | Poland | 96.4 /100 | #98 | Exceptional 2.4% |
| Immigrants | Israel | 96.1 /100 | #99 | Exceptional 2.4% |
| Europeans | 95.8 /100 | #100 | Exceptional 2.4% |
| Immigrants | Scotland | 95.7 /100 | #101 | Exceptional 2.4% |
| Croatians | 95.0 /100 | #102 | Exceptional 2.4% |
| Alsatians | 94.9 /100 | #103 | Exceptional 2.4% |
| Bhutanese | 94.5 /100 | #104 | Exceptional 2.4% |