Immigrants from Austria vs Swiss Self-Care Disability
COMPARE
Immigrants from Austria
Swiss
Self-Care Disability
Self-Care Disability Comparison
Immigrants from Austria
Swiss
2.4%
SELF-CARE DISABILITY
89.0/ 100
METRIC RATING
130th/ 347
METRIC RANK
2.4%
SELF-CARE DISABILITY
96.6/ 100
METRIC RATING
97th/ 347
METRIC RANK
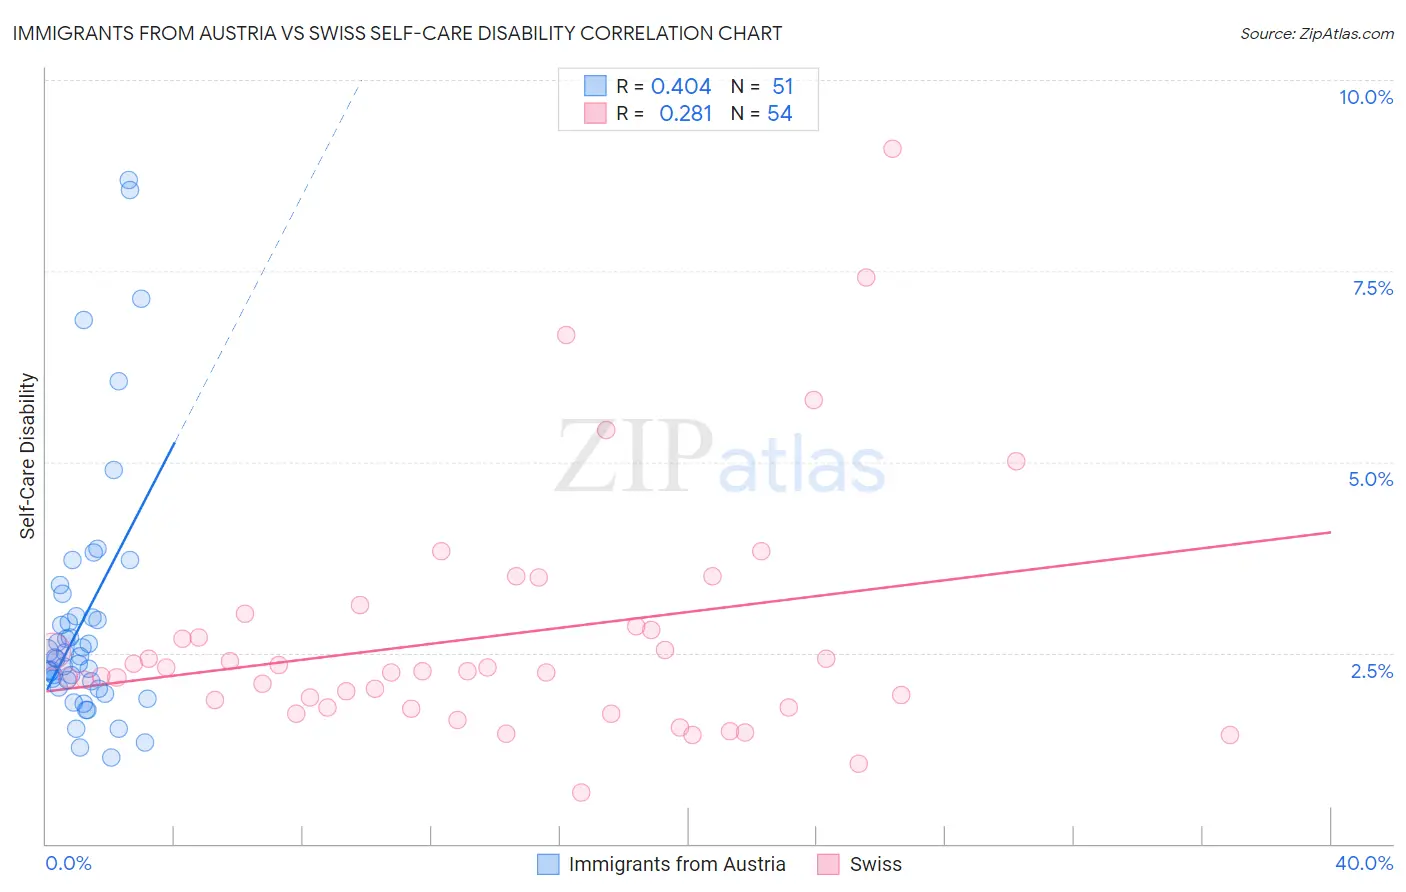
Immigrants from Austria vs Swiss Self-Care Disability Correlation Chart
The statistical analysis conducted on geographies consisting of 167,909,652 people shows a moderate positive correlation between the proportion of Immigrants from Austria and percentage of population with self-care disability in the United States with a correlation coefficient (R) of 0.404 and weighted average of 2.4%. Similarly, the statistical analysis conducted on geographies consisting of 464,154,677 people shows a weak positive correlation between the proportion of Swiss and percentage of population with self-care disability in the United States with a correlation coefficient (R) of 0.281 and weighted average of 2.4%, a difference of 1.5%.
Self-Care Disability Correlation Summary
| Measurement | Immigrants from Austria | Swiss |
| Minimum | 1.1% | 0.66% |
| Maximum | 8.7% | 9.1% |
| Range | 7.6% | 8.4% |
| Mean | 3.0% | 2.7% |
| Median | 2.4% | 2.3% |
| Interquartile 25% (IQ1) | 2.0% | 1.8% |
| Interquartile 75% (IQ3) | 3.0% | 2.9% |
| Interquartile Range (IQR) | 0.94% | 1.1% |
| Standard Deviation (Sample) | 1.7% | 1.6% |
| Standard Deviation (Population) | 1.7% | 1.6% |
Similar Demographics by Self-Care Disability
Demographics Similar to Immigrants from Austria by Self-Care Disability
In terms of self-care disability, the demographic groups most similar to Immigrants from Austria are Polish (2.4%, a difference of 0.020%), Immigrants from Romania (2.4%, a difference of 0.030%), Immigrants from South America (2.4%, a difference of 0.030%), Immigrants from Colombia (2.4%, a difference of 0.060%), and Colombian (2.4%, a difference of 0.080%).
| Demographics | Rating | Rank | Self-Care Disability |
| Immigrants | Nigeria | 90.3 /100 | #123 | Exceptional 2.4% |
| Immigrants | Morocco | 90.2 /100 | #124 | Exceptional 2.4% |
| Immigrants | North America | 90.2 /100 | #124 | Exceptional 2.4% |
| Hmong | 89.9 /100 | #126 | Excellent 2.4% |
| Colombians | 89.7 /100 | #127 | Excellent 2.4% |
| Immigrants | Hungary | 89.6 /100 | #128 | Excellent 2.4% |
| Immigrants | Romania | 89.3 /100 | #129 | Excellent 2.4% |
| Immigrants | Austria | 89.0 /100 | #130 | Excellent 2.4% |
| Poles | 88.9 /100 | #131 | Excellent 2.4% |
| Immigrants | South America | 88.8 /100 | #132 | Excellent 2.4% |
| Immigrants | Colombia | 88.5 /100 | #133 | Excellent 2.4% |
| Russians | 88.2 /100 | #134 | Excellent 2.4% |
| Laotians | 87.8 /100 | #135 | Excellent 2.4% |
| South American Indians | 87.2 /100 | #136 | Excellent 2.4% |
| Austrians | 87.0 /100 | #137 | Excellent 2.4% |
Demographics Similar to Swiss by Self-Care Disability
In terms of self-care disability, the demographic groups most similar to Swiss are Immigrants from Chile (2.4%, a difference of 0.040%), Immigrants from Poland (2.4%, a difference of 0.090%), Immigrants from Asia (2.4%, a difference of 0.10%), Macedonian (2.4%, a difference of 0.11%), and Immigrants from Latvia (2.4%, a difference of 0.16%).
| Demographics | Rating | Rank | Self-Care Disability |
| Immigrants | Czechoslovakia | 97.7 /100 | #90 | Exceptional 2.4% |
| Immigrants | Jordan | 97.7 /100 | #91 | Exceptional 2.4% |
| Icelanders | 97.4 /100 | #92 | Exceptional 2.4% |
| Immigrants | Latvia | 97.0 /100 | #93 | Exceptional 2.4% |
| Macedonians | 96.9 /100 | #94 | Exceptional 2.4% |
| Immigrants | Asia | 96.9 /100 | #95 | Exceptional 2.4% |
| Immigrants | Chile | 96.7 /100 | #96 | Exceptional 2.4% |
| Swiss | 96.6 /100 | #97 | Exceptional 2.4% |
| Immigrants | Poland | 96.4 /100 | #98 | Exceptional 2.4% |
| Immigrants | Israel | 96.1 /100 | #99 | Exceptional 2.4% |
| Europeans | 95.8 /100 | #100 | Exceptional 2.4% |
| Immigrants | Scotland | 95.7 /100 | #101 | Exceptional 2.4% |
| Croatians | 95.0 /100 | #102 | Exceptional 2.4% |
| Alsatians | 94.9 /100 | #103 | Exceptional 2.4% |
| Bhutanese | 94.5 /100 | #104 | Exceptional 2.4% |