Immigrants from Bulgaria vs Immigrants from Sierra Leone Disability Age Under 5
COMPARE
Immigrants from Bulgaria
Immigrants from Sierra Leone
Disability Age Under 5
Disability Age Under 5 Comparison
Immigrants from Bulgaria
Immigrants from Sierra Leone
1.1%
DISABILITY AGE UNDER 5
99.8/ 100
METRIC RATING
42nd/ 347
METRIC RANK
1.3%
DISABILITY AGE UNDER 5
36.5/ 100
METRIC RATING
193rd/ 347
METRIC RANK
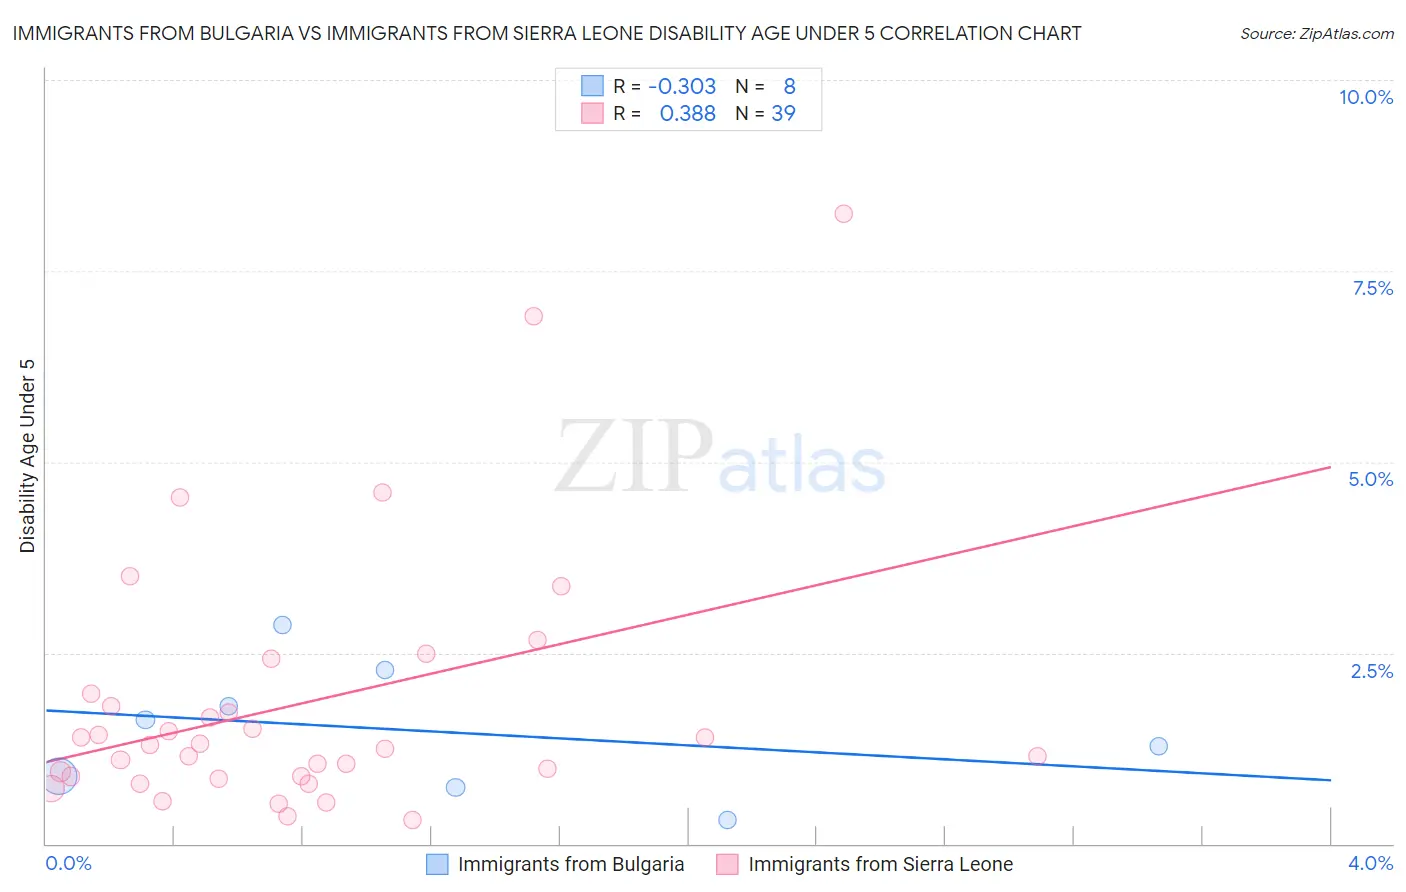
Immigrants from Bulgaria vs Immigrants from Sierra Leone Disability Age Under 5 Correlation Chart
The statistical analysis conducted on geographies consisting of 114,268,048 people shows a mild negative correlation between the proportion of Immigrants from Bulgaria and percentage of population with a disability under the age of 5 in the United States with a correlation coefficient (R) of -0.303 and weighted average of 1.1%. Similarly, the statistical analysis conducted on geographies consisting of 77,055,630 people shows a mild positive correlation between the proportion of Immigrants from Sierra Leone and percentage of population with a disability under the age of 5 in the United States with a correlation coefficient (R) of 0.388 and weighted average of 1.3%, a difference of 18.3%.
Disability Age Under 5 Correlation Summary
| Measurement | Immigrants from Bulgaria | Immigrants from Sierra Leone |
| Minimum | 0.31% | 0.31% |
| Maximum | 2.9% | 8.2% |
| Range | 2.6% | 7.9% |
| Mean | 1.5% | 1.8% |
| Median | 1.5% | 1.3% |
| Interquartile 25% (IQ1) | 0.81% | 0.88% |
| Interquartile 75% (IQ3) | 2.0% | 2.0% |
| Interquartile Range (IQR) | 1.2% | 1.1% |
| Standard Deviation (Sample) | 0.84% | 1.7% |
| Standard Deviation (Population) | 0.79% | 1.7% |
Similar Demographics by Disability Age Under 5
Demographics Similar to Immigrants from Bulgaria by Disability Age Under 5
In terms of disability age under 5, the demographic groups most similar to Immigrants from Bulgaria are Pima (1.1%, a difference of 0.010%), Thai (1.1%, a difference of 0.10%), Immigrants from Asia (1.1%, a difference of 0.11%), Immigrants from Turkey (1.1%, a difference of 0.33%), and Immigrants from Albania (1.1%, a difference of 0.51%).
| Demographics | Rating | Rank | Disability Age Under 5 |
| Barbadians | 99.9 /100 | #35 | Exceptional 1.0% |
| Immigrants | Nepal | 99.9 /100 | #36 | Exceptional 1.0% |
| Immigrants | India | 99.9 /100 | #37 | Exceptional 1.0% |
| Immigrants | Guyana | 99.9 /100 | #38 | Exceptional 1.0% |
| Filipinos | 99.9 /100 | #39 | Exceptional 1.1% |
| Immigrants | Albania | 99.9 /100 | #40 | Exceptional 1.1% |
| Thais | 99.8 /100 | #41 | Exceptional 1.1% |
| Immigrants | Bulgaria | 99.8 /100 | #42 | Exceptional 1.1% |
| Pima | 99.8 /100 | #43 | Exceptional 1.1% |
| Immigrants | Asia | 99.8 /100 | #44 | Exceptional 1.1% |
| Immigrants | Turkey | 99.8 /100 | #45 | Exceptional 1.1% |
| Immigrants | Congo | 99.8 /100 | #46 | Exceptional 1.1% |
| Immigrants | Sweden | 99.8 /100 | #47 | Exceptional 1.1% |
| Immigrants | Singapore | 99.7 /100 | #48 | Exceptional 1.1% |
| Immigrants | Russia | 99.7 /100 | #49 | Exceptional 1.1% |
Demographics Similar to Immigrants from Sierra Leone by Disability Age Under 5
In terms of disability age under 5, the demographic groups most similar to Immigrants from Sierra Leone are Mexican American Indian (1.3%, a difference of 0.0%), Immigrants from Bosnia and Herzegovina (1.3%, a difference of 0.0%), Immigrants from Laos (1.3%, a difference of 0.010%), Peruvian (1.3%, a difference of 0.11%), and Immigrants from North Macedonia (1.3%, a difference of 0.18%).
| Demographics | Rating | Rank | Disability Age Under 5 |
| Cubans | 42.5 /100 | #186 | Average 1.2% |
| Immigrants | Haiti | 40.2 /100 | #187 | Average 1.3% |
| Haitians | 39.9 /100 | #188 | Fair 1.3% |
| Peruvians | 37.6 /100 | #189 | Fair 1.3% |
| Immigrants | Laos | 36.6 /100 | #190 | Fair 1.3% |
| Mexican American Indians | 36.6 /100 | #191 | Fair 1.3% |
| Immigrants | Bosnia and Herzegovina | 36.5 /100 | #192 | Fair 1.3% |
| Immigrants | Sierra Leone | 36.5 /100 | #193 | Fair 1.3% |
| Immigrants | North Macedonia | 34.7 /100 | #194 | Fair 1.3% |
| U.S. Virgin Islanders | 34.4 /100 | #195 | Fair 1.3% |
| Immigrants | Belgium | 31.4 /100 | #196 | Fair 1.3% |
| Immigrants | Somalia | 31.3 /100 | #197 | Fair 1.3% |
| Immigrants | Norway | 31.1 /100 | #198 | Fair 1.3% |
| Jamaicans | 30.7 /100 | #199 | Fair 1.3% |
| Immigrants | Lithuania | 27.2 /100 | #200 | Fair 1.3% |