Irish vs Immigrants from Sierra Leone Disability Age Under 5
COMPARE
Irish
Immigrants from Sierra Leone
Disability Age Under 5
Disability Age Under 5 Comparison
Irish
Immigrants from Sierra Leone
1.7%
DISABILITY AGE UNDER 5
0.0/ 100
METRIC RATING
318th/ 347
METRIC RANK
1.3%
DISABILITY AGE UNDER 5
36.5/ 100
METRIC RATING
193rd/ 347
METRIC RANK
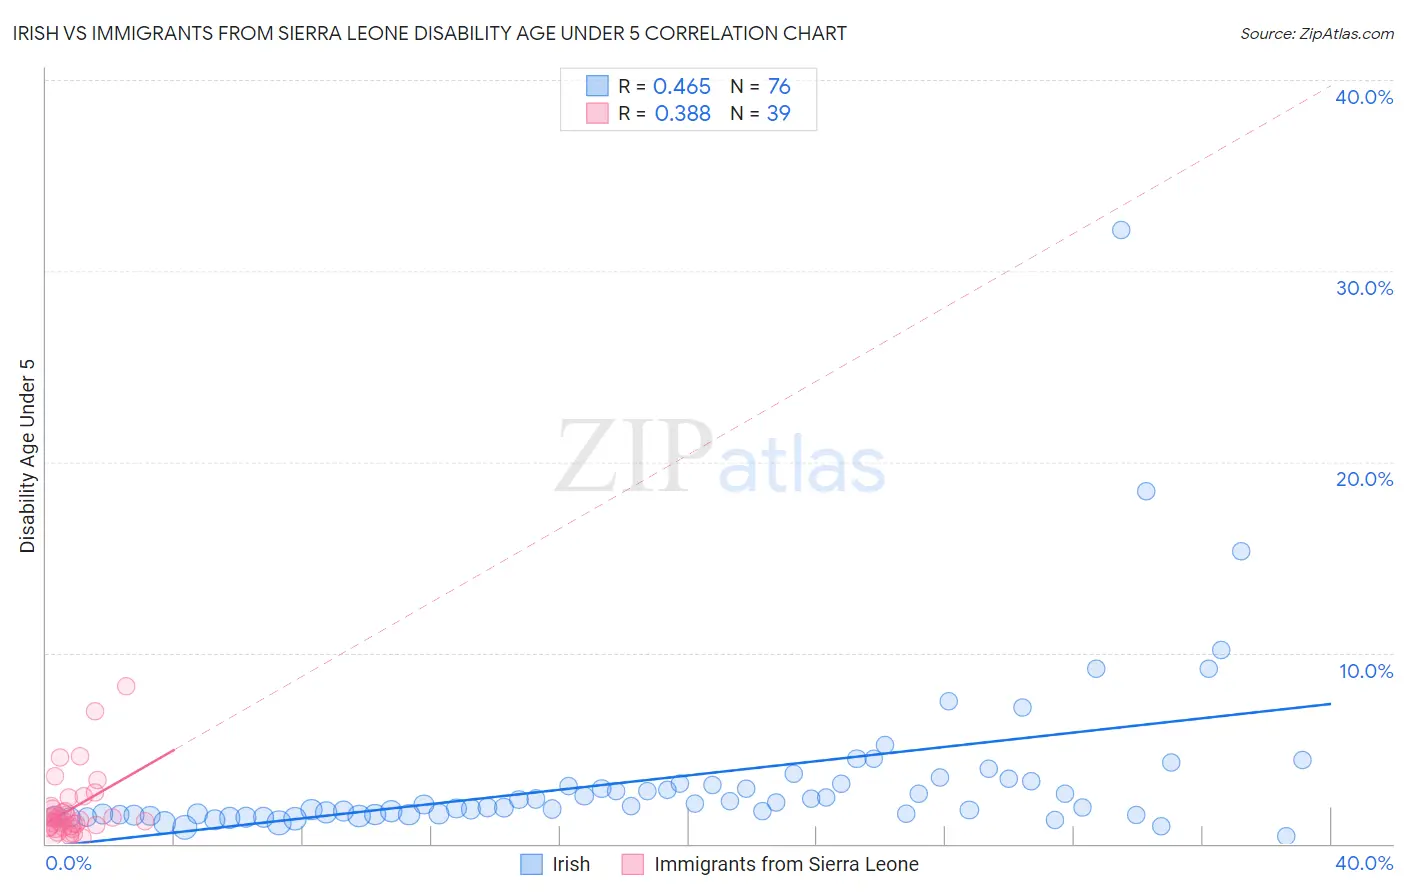
Irish vs Immigrants from Sierra Leone Disability Age Under 5 Correlation Chart
The statistical analysis conducted on geographies consisting of 261,602,984 people shows a moderate positive correlation between the proportion of Irish and percentage of population with a disability under the age of 5 in the United States with a correlation coefficient (R) of 0.465 and weighted average of 1.7%. Similarly, the statistical analysis conducted on geographies consisting of 77,055,630 people shows a mild positive correlation between the proportion of Immigrants from Sierra Leone and percentage of population with a disability under the age of 5 in the United States with a correlation coefficient (R) of 0.388 and weighted average of 1.3%, a difference of 35.1%.
Disability Age Under 5 Correlation Summary
| Measurement | Irish | Immigrants from Sierra Leone |
| Minimum | 0.37% | 0.31% |
| Maximum | 32.1% | 8.2% |
| Range | 31.8% | 7.9% |
| Mean | 3.4% | 1.8% |
| Median | 2.0% | 1.3% |
| Interquartile 25% (IQ1) | 1.5% | 0.88% |
| Interquartile 75% (IQ3) | 3.2% | 2.0% |
| Interquartile Range (IQR) | 1.6% | 1.1% |
| Standard Deviation (Sample) | 4.5% | 1.7% |
| Standard Deviation (Population) | 4.4% | 1.7% |
Similar Demographics by Disability Age Under 5
Demographics Similar to Irish by Disability Age Under 5
In terms of disability age under 5, the demographic groups most similar to Irish are French (1.7%, a difference of 0.27%), Slovak (1.7%, a difference of 0.31%), Immigrants from Cabo Verde (1.7%, a difference of 0.69%), Scotch-Irish (1.7%, a difference of 0.84%), and Dutch (1.7%, a difference of 0.88%).
| Demographics | Rating | Rank | Disability Age Under 5 |
| English | 0.0 /100 | #311 | Tragic 1.7% |
| Puerto Ricans | 0.0 /100 | #312 | Tragic 1.7% |
| Celtics | 0.0 /100 | #313 | Tragic 1.7% |
| Norwegians | 0.0 /100 | #314 | Tragic 1.7% |
| Dutch | 0.0 /100 | #315 | Tragic 1.7% |
| Immigrants | Cabo Verde | 0.0 /100 | #316 | Tragic 1.7% |
| French | 0.0 /100 | #317 | Tragic 1.7% |
| Irish | 0.0 /100 | #318 | Tragic 1.7% |
| Slovaks | 0.0 /100 | #319 | Tragic 1.7% |
| Scotch-Irish | 0.0 /100 | #320 | Tragic 1.7% |
| Ottawa | 0.0 /100 | #321 | Tragic 1.7% |
| Germans | 0.0 /100 | #322 | Tragic 1.7% |
| Chickasaw | 0.0 /100 | #323 | Tragic 1.7% |
| Cherokee | 0.0 /100 | #324 | Tragic 1.8% |
| Immigrants | Portugal | 0.0 /100 | #325 | Tragic 1.8% |
Demographics Similar to Immigrants from Sierra Leone by Disability Age Under 5
In terms of disability age under 5, the demographic groups most similar to Immigrants from Sierra Leone are Mexican American Indian (1.3%, a difference of 0.0%), Immigrants from Bosnia and Herzegovina (1.3%, a difference of 0.0%), Immigrants from Laos (1.3%, a difference of 0.010%), Peruvian (1.3%, a difference of 0.11%), and Immigrants from North Macedonia (1.3%, a difference of 0.18%).
| Demographics | Rating | Rank | Disability Age Under 5 |
| Cubans | 42.5 /100 | #186 | Average 1.2% |
| Immigrants | Haiti | 40.2 /100 | #187 | Average 1.3% |
| Haitians | 39.9 /100 | #188 | Fair 1.3% |
| Peruvians | 37.6 /100 | #189 | Fair 1.3% |
| Immigrants | Laos | 36.6 /100 | #190 | Fair 1.3% |
| Mexican American Indians | 36.6 /100 | #191 | Fair 1.3% |
| Immigrants | Bosnia and Herzegovina | 36.5 /100 | #192 | Fair 1.3% |
| Immigrants | Sierra Leone | 36.5 /100 | #193 | Fair 1.3% |
| Immigrants | North Macedonia | 34.7 /100 | #194 | Fair 1.3% |
| U.S. Virgin Islanders | 34.4 /100 | #195 | Fair 1.3% |
| Immigrants | Belgium | 31.4 /100 | #196 | Fair 1.3% |
| Immigrants | Somalia | 31.3 /100 | #197 | Fair 1.3% |
| Immigrants | Norway | 31.1 /100 | #198 | Fair 1.3% |
| Jamaicans | 30.7 /100 | #199 | Fair 1.3% |
| Immigrants | Lithuania | 27.2 /100 | #200 | Fair 1.3% |