Finnish vs Immigrants from North America Cognitive Disability
COMPARE
Finnish
Immigrants from North America
Cognitive Disability
Cognitive Disability Comparison
Finns
Immigrants from North America
16.8%
COGNITIVE DISABILITY
98.5/ 100
METRIC RATING
96th/ 347
METRIC RANK
16.5%
COGNITIVE DISABILITY
99.8/ 100
METRIC RATING
48th/ 347
METRIC RANK
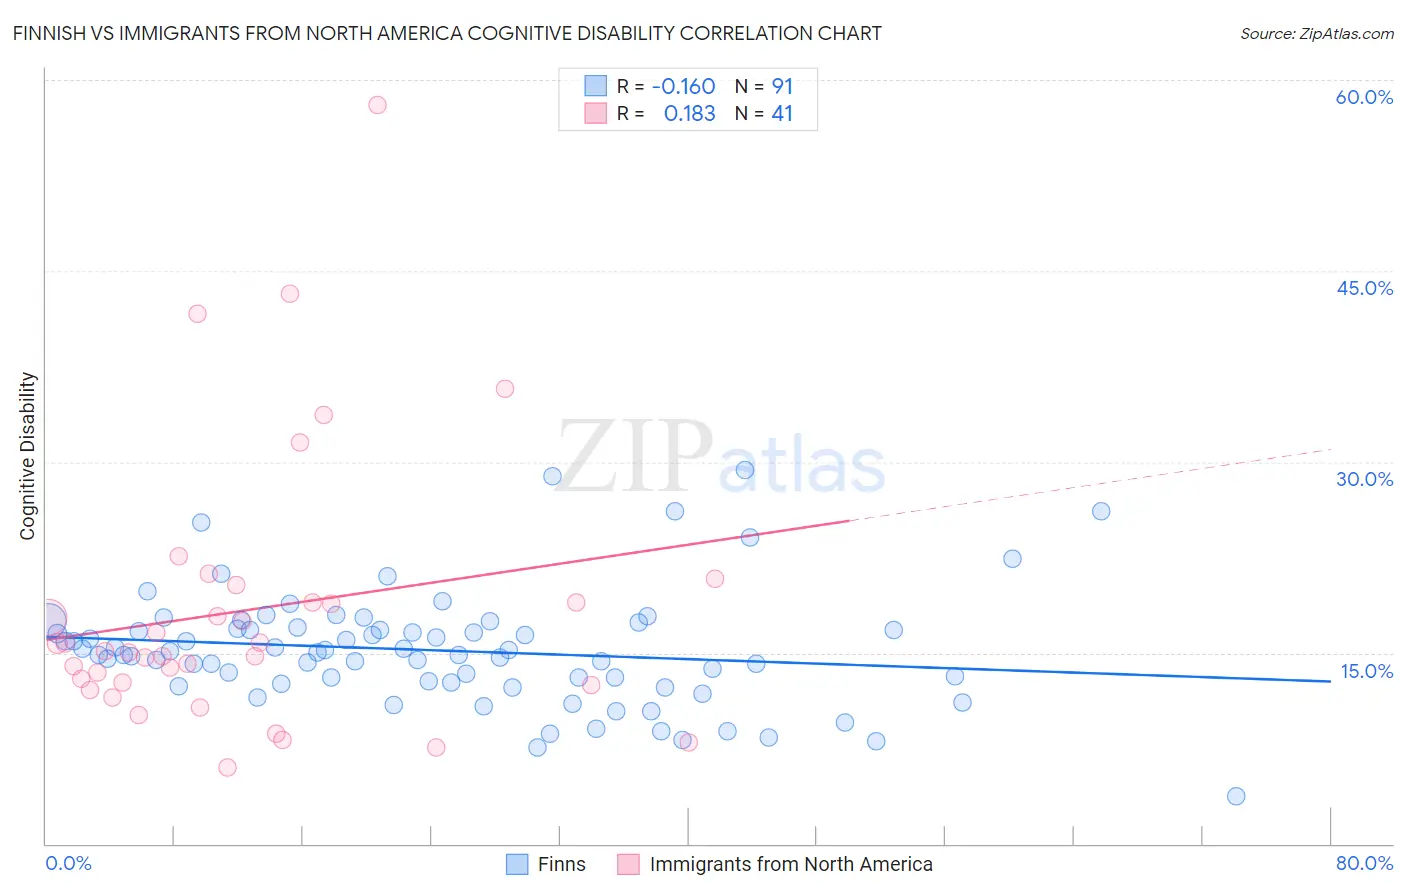
Finnish vs Immigrants from North America Cognitive Disability Correlation Chart
The statistical analysis conducted on geographies consisting of 404,634,462 people shows a poor negative correlation between the proportion of Finns and percentage of population with cognitive disability in the United States with a correlation coefficient (R) of -0.160 and weighted average of 16.8%. Similarly, the statistical analysis conducted on geographies consisting of 462,435,369 people shows a poor positive correlation between the proportion of Immigrants from North America and percentage of population with cognitive disability in the United States with a correlation coefficient (R) of 0.183 and weighted average of 16.5%, a difference of 1.6%.
Cognitive Disability Correlation Summary
| Measurement | Finnish | Immigrants from North America |
| Minimum | 3.7% | 6.0% |
| Maximum | 29.3% | 58.1% |
| Range | 25.6% | 52.1% |
| Mean | 15.2% | 18.4% |
| Median | 15.1% | 15.1% |
| Interquartile 25% (IQ1) | 12.6% | 12.6% |
| Interquartile 75% (IQ3) | 16.9% | 19.7% |
| Interquartile Range (IQR) | 4.2% | 7.1% |
| Standard Deviation (Sample) | 4.5% | 10.7% |
| Standard Deviation (Population) | 4.5% | 10.5% |
Similar Demographics by Cognitive Disability
Demographics Similar to Finns by Cognitive Disability
In terms of cognitive disability, the demographic groups most similar to Finns are Dutch (16.8%, a difference of 0.010%), English (16.8%, a difference of 0.020%), Immigrants from Lebanon (16.8%, a difference of 0.040%), Asian (16.7%, a difference of 0.090%), and Jordanian (16.8%, a difference of 0.12%).
| Demographics | Rating | Rank | Cognitive Disability |
| Immigrants | Egypt | 98.8 /100 | #89 | Exceptional 16.7% |
| South Americans | 98.8 /100 | #90 | Exceptional 16.7% |
| Danes | 98.8 /100 | #91 | Exceptional 16.7% |
| Immigrants | South America | 98.8 /100 | #92 | Exceptional 16.7% |
| Immigrants | Southern Europe | 98.7 /100 | #93 | Exceptional 16.7% |
| Asians | 98.7 /100 | #94 | Exceptional 16.7% |
| English | 98.6 /100 | #95 | Exceptional 16.8% |
| Finns | 98.5 /100 | #96 | Exceptional 16.8% |
| Dutch | 98.5 /100 | #97 | Exceptional 16.8% |
| Immigrants | Lebanon | 98.4 /100 | #98 | Exceptional 16.8% |
| Jordanians | 98.2 /100 | #99 | Exceptional 16.8% |
| Immigrants | Russia | 98.2 /100 | #100 | Exceptional 16.8% |
| Immigrants | Asia | 98.1 /100 | #101 | Exceptional 16.8% |
| Irish | 98.1 /100 | #102 | Exceptional 16.8% |
| Paraguayans | 98.0 /100 | #103 | Exceptional 16.8% |
Demographics Similar to Immigrants from North America by Cognitive Disability
In terms of cognitive disability, the demographic groups most similar to Immigrants from North America are Immigrants from Italy (16.5%, a difference of 0.0%), Immigrants from Colombia (16.5%, a difference of 0.030%), Immigrants from Europe (16.5%, a difference of 0.040%), Iranian (16.5%, a difference of 0.040%), and Macedonian (16.5%, a difference of 0.050%).
| Demographics | Rating | Rank | Cognitive Disability |
| Cubans | 99.9 /100 | #41 | Exceptional 16.5% |
| Hungarians | 99.9 /100 | #42 | Exceptional 16.5% |
| Immigrants | Canada | 99.8 /100 | #43 | Exceptional 16.5% |
| Macedonians | 99.8 /100 | #44 | Exceptional 16.5% |
| Immigrants | Europe | 99.8 /100 | #45 | Exceptional 16.5% |
| Immigrants | Colombia | 99.8 /100 | #46 | Exceptional 16.5% |
| Immigrants | Italy | 99.8 /100 | #47 | Exceptional 16.5% |
| Immigrants | North America | 99.8 /100 | #48 | Exceptional 16.5% |
| Iranians | 99.8 /100 | #49 | Exceptional 16.5% |
| Norwegians | 99.8 /100 | #50 | Exceptional 16.5% |
| Immigrants | Korea | 99.8 /100 | #51 | Exceptional 16.5% |
| Soviet Union | 99.8 /100 | #52 | Exceptional 16.5% |
| Swedes | 99.8 /100 | #53 | Exceptional 16.5% |
| Immigrants | Iran | 99.8 /100 | #54 | Exceptional 16.5% |
| Immigrants | Venezuela | 99.7 /100 | #55 | Exceptional 16.5% |