Finnish vs Immigrants from France Cognitive Disability
COMPARE
Finnish
Immigrants from France
Cognitive Disability
Cognitive Disability Comparison
Finns
Immigrants from France
16.8%
COGNITIVE DISABILITY
98.5/ 100
METRIC RATING
96th/ 347
METRIC RANK
17.4%
COGNITIVE DISABILITY
29.8/ 100
METRIC RATING
188th/ 347
METRIC RANK
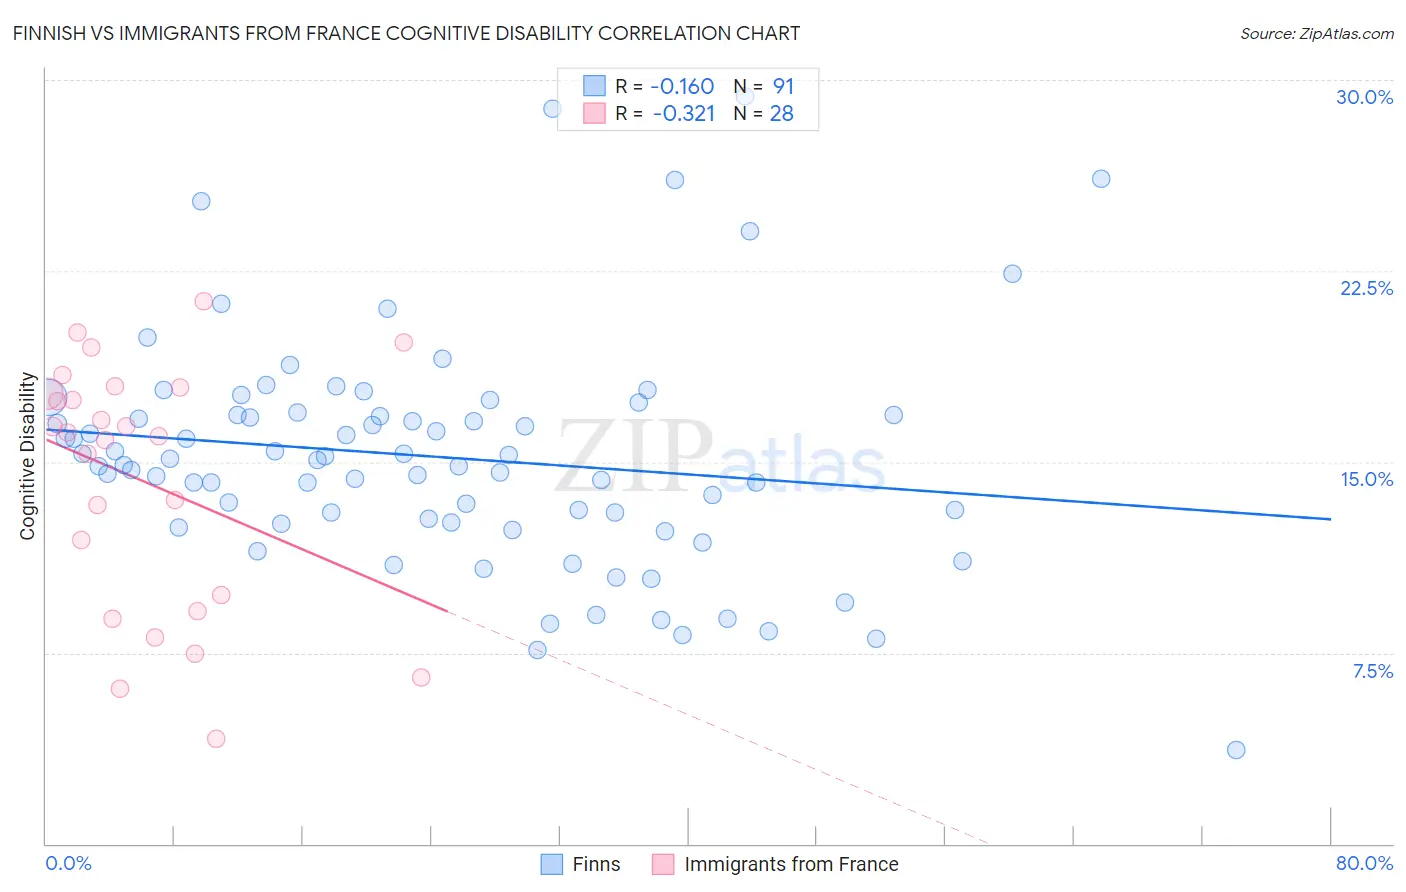
Finnish vs Immigrants from France Cognitive Disability Correlation Chart
The statistical analysis conducted on geographies consisting of 404,634,462 people shows a poor negative correlation between the proportion of Finns and percentage of population with cognitive disability in the United States with a correlation coefficient (R) of -0.160 and weighted average of 16.8%. Similarly, the statistical analysis conducted on geographies consisting of 287,908,122 people shows a mild negative correlation between the proportion of Immigrants from France and percentage of population with cognitive disability in the United States with a correlation coefficient (R) of -0.321 and weighted average of 17.4%, a difference of 3.7%.
Cognitive Disability Correlation Summary
| Measurement | Finnish | Immigrants from France |
| Minimum | 3.7% | 4.1% |
| Maximum | 29.3% | 21.3% |
| Range | 25.6% | 17.2% |
| Mean | 15.2% | 14.3% |
| Median | 15.1% | 16.1% |
| Interquartile 25% (IQ1) | 12.6% | 9.5% |
| Interquartile 75% (IQ3) | 16.9% | 17.8% |
| Interquartile Range (IQR) | 4.2% | 8.3% |
| Standard Deviation (Sample) | 4.5% | 4.9% |
| Standard Deviation (Population) | 4.5% | 4.8% |
Similar Demographics by Cognitive Disability
Demographics Similar to Finns by Cognitive Disability
In terms of cognitive disability, the demographic groups most similar to Finns are Dutch (16.8%, a difference of 0.010%), English (16.8%, a difference of 0.020%), Immigrants from Lebanon (16.8%, a difference of 0.040%), Asian (16.7%, a difference of 0.090%), and Jordanian (16.8%, a difference of 0.12%).
| Demographics | Rating | Rank | Cognitive Disability |
| Immigrants | Egypt | 98.8 /100 | #89 | Exceptional 16.7% |
| South Americans | 98.8 /100 | #90 | Exceptional 16.7% |
| Danes | 98.8 /100 | #91 | Exceptional 16.7% |
| Immigrants | South America | 98.8 /100 | #92 | Exceptional 16.7% |
| Immigrants | Southern Europe | 98.7 /100 | #93 | Exceptional 16.7% |
| Asians | 98.7 /100 | #94 | Exceptional 16.7% |
| English | 98.6 /100 | #95 | Exceptional 16.8% |
| Finns | 98.5 /100 | #96 | Exceptional 16.8% |
| Dutch | 98.5 /100 | #97 | Exceptional 16.8% |
| Immigrants | Lebanon | 98.4 /100 | #98 | Exceptional 16.8% |
| Jordanians | 98.2 /100 | #99 | Exceptional 16.8% |
| Immigrants | Russia | 98.2 /100 | #100 | Exceptional 16.8% |
| Immigrants | Asia | 98.1 /100 | #101 | Exceptional 16.8% |
| Irish | 98.1 /100 | #102 | Exceptional 16.8% |
| Paraguayans | 98.0 /100 | #103 | Exceptional 16.8% |
Demographics Similar to Immigrants from France by Cognitive Disability
In terms of cognitive disability, the demographic groups most similar to Immigrants from France are Immigrants from Western Asia (17.4%, a difference of 0.010%), Immigrants from Spain (17.4%, a difference of 0.070%), Nonimmigrants (17.4%, a difference of 0.080%), Immigrants from Haiti (17.4%, a difference of 0.090%), and Immigrants from Fiji (17.4%, a difference of 0.13%).
| Demographics | Rating | Rank | Cognitive Disability |
| Immigrants | Guyana | 42.9 /100 | #181 | Average 17.3% |
| Arabs | 42.8 /100 | #182 | Average 17.3% |
| Spaniards | 40.3 /100 | #183 | Average 17.3% |
| Crow | 39.1 /100 | #184 | Fair 17.3% |
| Afghans | 38.2 /100 | #185 | Fair 17.3% |
| Cambodians | 35.9 /100 | #186 | Fair 17.3% |
| Immigrants | Fiji | 33.7 /100 | #187 | Fair 17.4% |
| Immigrants | France | 29.8 /100 | #188 | Fair 17.4% |
| Immigrants | Western Asia | 29.5 /100 | #189 | Fair 17.4% |
| Immigrants | Spain | 27.7 /100 | #190 | Fair 17.4% |
| Immigrants | Nonimmigrants | 27.4 /100 | #191 | Fair 17.4% |
| Immigrants | Haiti | 27.1 /100 | #192 | Fair 17.4% |
| Delaware | 25.6 /100 | #193 | Fair 17.4% |
| Immigrants | Bosnia and Herzegovina | 22.0 /100 | #194 | Fair 17.4% |
| New Zealanders | 21.1 /100 | #195 | Fair 17.4% |