Finnish vs Immigrants from West Indies Cognitive Disability
COMPARE
Finnish
Immigrants from West Indies
Cognitive Disability
Cognitive Disability Comparison
Finns
Immigrants from West Indies
16.8%
COGNITIVE DISABILITY
98.5/ 100
METRIC RATING
96th/ 347
METRIC RANK
18.1%
COGNITIVE DISABILITY
0.1/ 100
METRIC RATING
288th/ 347
METRIC RANK
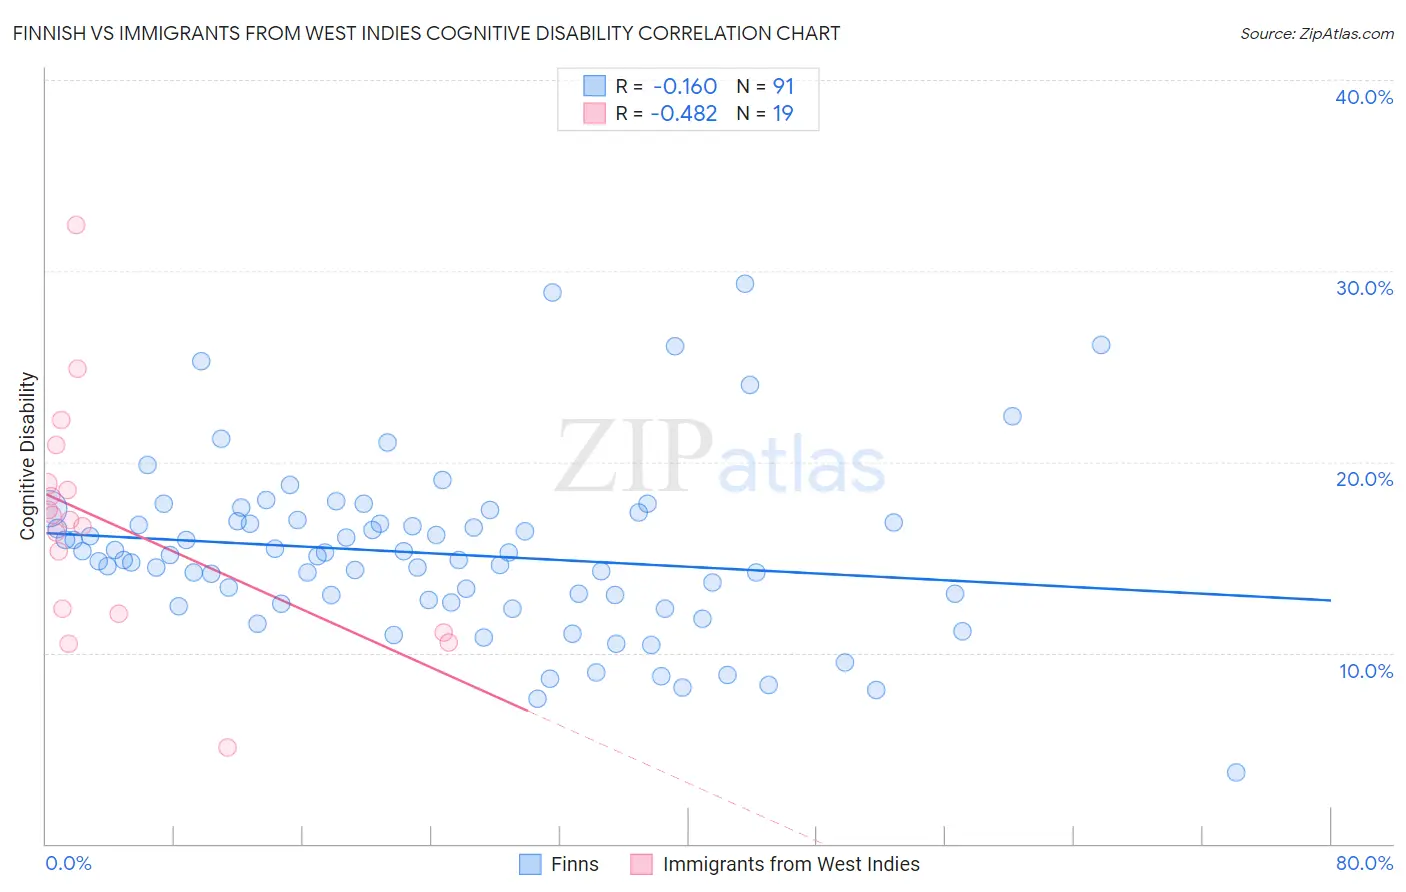
Finnish vs Immigrants from West Indies Cognitive Disability Correlation Chart
The statistical analysis conducted on geographies consisting of 404,634,462 people shows a poor negative correlation between the proportion of Finns and percentage of population with cognitive disability in the United States with a correlation coefficient (R) of -0.160 and weighted average of 16.8%. Similarly, the statistical analysis conducted on geographies consisting of 72,456,461 people shows a moderate negative correlation between the proportion of Immigrants from West Indies and percentage of population with cognitive disability in the United States with a correlation coefficient (R) of -0.482 and weighted average of 18.1%, a difference of 8.2%.
Cognitive Disability Correlation Summary
| Measurement | Finnish | Immigrants from West Indies |
| Minimum | 3.7% | 5.0% |
| Maximum | 29.3% | 32.4% |
| Range | 25.6% | 27.4% |
| Mean | 15.2% | 16.7% |
| Median | 15.1% | 16.9% |
| Interquartile 25% (IQ1) | 12.6% | 12.1% |
| Interquartile 75% (IQ3) | 16.9% | 18.8% |
| Interquartile Range (IQR) | 4.2% | 6.8% |
| Standard Deviation (Sample) | 4.5% | 6.0% |
| Standard Deviation (Population) | 4.5% | 5.9% |
Similar Demographics by Cognitive Disability
Demographics Similar to Finns by Cognitive Disability
In terms of cognitive disability, the demographic groups most similar to Finns are Dutch (16.8%, a difference of 0.010%), English (16.8%, a difference of 0.020%), Immigrants from Lebanon (16.8%, a difference of 0.040%), Asian (16.7%, a difference of 0.090%), and Jordanian (16.8%, a difference of 0.12%).
| Demographics | Rating | Rank | Cognitive Disability |
| Immigrants | Egypt | 98.8 /100 | #89 | Exceptional 16.7% |
| South Americans | 98.8 /100 | #90 | Exceptional 16.7% |
| Danes | 98.8 /100 | #91 | Exceptional 16.7% |
| Immigrants | South America | 98.8 /100 | #92 | Exceptional 16.7% |
| Immigrants | Southern Europe | 98.7 /100 | #93 | Exceptional 16.7% |
| Asians | 98.7 /100 | #94 | Exceptional 16.7% |
| English | 98.6 /100 | #95 | Exceptional 16.8% |
| Finns | 98.5 /100 | #96 | Exceptional 16.8% |
| Dutch | 98.5 /100 | #97 | Exceptional 16.8% |
| Immigrants | Lebanon | 98.4 /100 | #98 | Exceptional 16.8% |
| Jordanians | 98.2 /100 | #99 | Exceptional 16.8% |
| Immigrants | Russia | 98.2 /100 | #100 | Exceptional 16.8% |
| Immigrants | Asia | 98.1 /100 | #101 | Exceptional 16.8% |
| Irish | 98.1 /100 | #102 | Exceptional 16.8% |
| Paraguayans | 98.0 /100 | #103 | Exceptional 16.8% |
Demographics Similar to Immigrants from West Indies by Cognitive Disability
In terms of cognitive disability, the demographic groups most similar to Immigrants from West Indies are Dutch West Indian (18.1%, a difference of 0.010%), Native/Alaskan (18.1%, a difference of 0.010%), Immigrants from Africa (18.1%, a difference of 0.040%), Kenyan (18.1%, a difference of 0.050%), and Bermudan (18.1%, a difference of 0.090%).
| Demographics | Rating | Rank | Cognitive Disability |
| Yakama | 0.1 /100 | #281 | Tragic 18.1% |
| Immigrants | Cambodia | 0.1 /100 | #282 | Tragic 18.1% |
| Nigerians | 0.1 /100 | #283 | Tragic 18.1% |
| Immigrants | Uganda | 0.1 /100 | #284 | Tragic 18.1% |
| Bermudans | 0.1 /100 | #285 | Tragic 18.1% |
| Kenyans | 0.1 /100 | #286 | Tragic 18.1% |
| Dutch West Indians | 0.1 /100 | #287 | Tragic 18.1% |
| Immigrants | West Indies | 0.1 /100 | #288 | Tragic 18.1% |
| Natives/Alaskans | 0.1 /100 | #289 | Tragic 18.1% |
| Immigrants | Africa | 0.1 /100 | #290 | Tragic 18.1% |
| Ottawa | 0.1 /100 | #291 | Tragic 18.2% |
| Iroquois | 0.1 /100 | #292 | Tragic 18.2% |
| Central American Indians | 0.1 /100 | #293 | Tragic 18.2% |
| British West Indians | 0.1 /100 | #294 | Tragic 18.2% |
| German Russians | 0.0 /100 | #295 | Tragic 18.2% |