African vs Apache Ambulatory Disability
COMPARE
African
Apache
Ambulatory Disability
Ambulatory Disability Comparison
Africans
Apache
7.0%
AMBULATORY DISABILITY
0.0/ 100
METRIC RATING
303rd/ 347
METRIC RANK
7.4%
AMBULATORY DISABILITY
0.0/ 100
METRIC RATING
321st/ 347
METRIC RANK
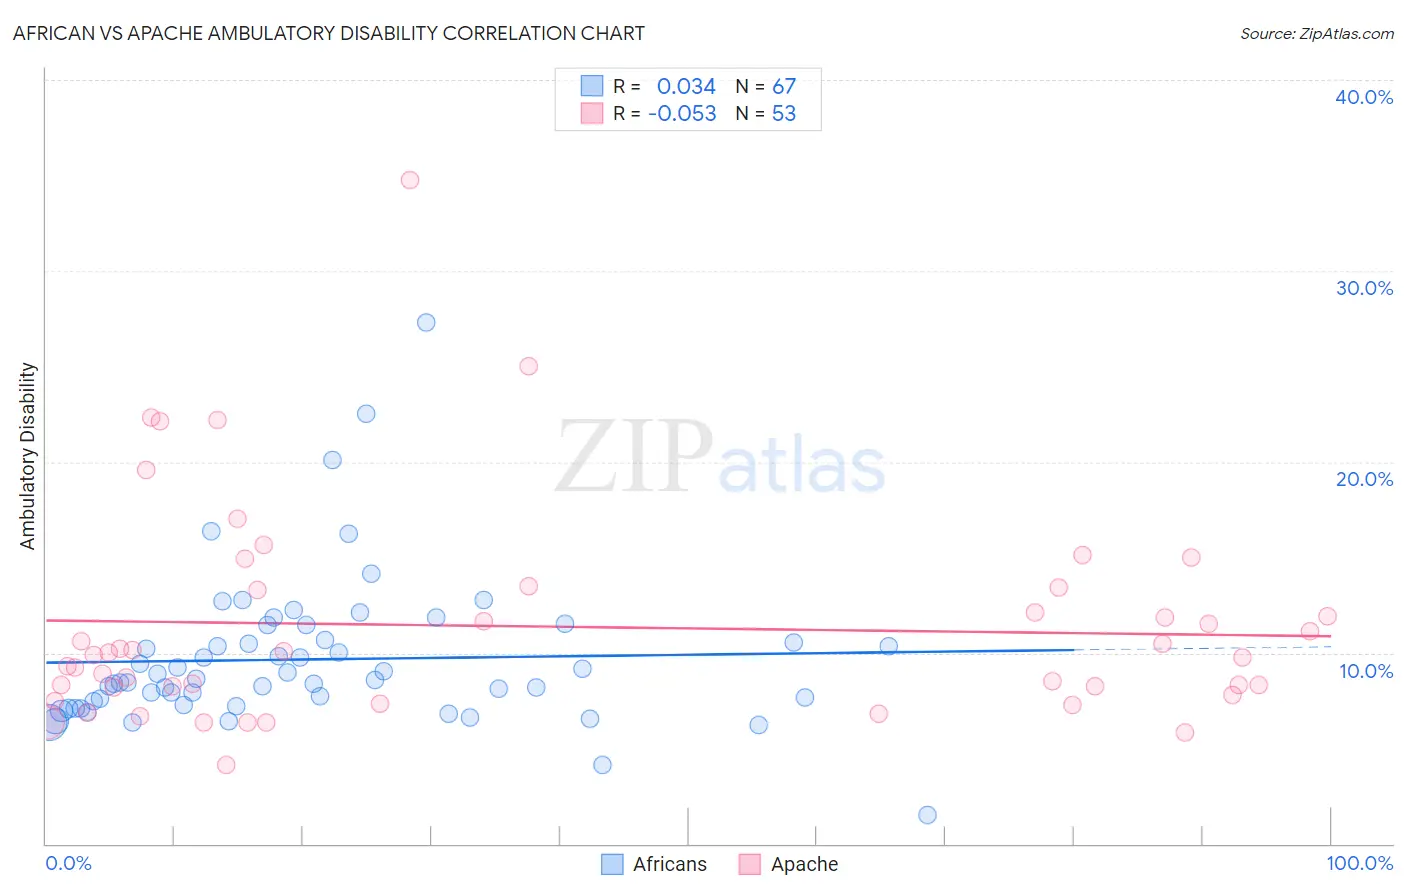
African vs Apache Ambulatory Disability Correlation Chart
The statistical analysis conducted on geographies consisting of 469,824,822 people shows no correlation between the proportion of Africans and percentage of population with ambulatory disability in the United States with a correlation coefficient (R) of 0.034 and weighted average of 7.0%. Similarly, the statistical analysis conducted on geographies consisting of 231,047,475 people shows a slight negative correlation between the proportion of Apache and percentage of population with ambulatory disability in the United States with a correlation coefficient (R) of -0.053 and weighted average of 7.4%, a difference of 5.9%.
Ambulatory Disability Correlation Summary
| Measurement | African | Apache |
| Minimum | 1.5% | 4.1% |
| Maximum | 27.3% | 34.8% |
| Range | 25.7% | 30.7% |
| Mean | 9.7% | 11.4% |
| Median | 8.6% | 9.9% |
| Interquartile 25% (IQ1) | 7.3% | 8.0% |
| Interquartile 75% (IQ3) | 10.6% | 13.4% |
| Interquartile Range (IQR) | 3.4% | 5.4% |
| Standard Deviation (Sample) | 3.9% | 5.7% |
| Standard Deviation (Population) | 3.9% | 5.6% |
Demographics Similar to Africans and Apache by Ambulatory Disability
In terms of ambulatory disability, the demographic groups most similar to Africans are Immigrants from Armenia (7.0%, a difference of 0.060%), Immigrants from Cabo Verde (7.0%, a difference of 0.36%), Immigrants from Micronesia (7.0%, a difference of 0.64%), Iroquois (7.1%, a difference of 1.2%), and Spanish American (7.1%, a difference of 1.4%). Similarly, the demographic groups most similar to Apache are Osage (7.4%, a difference of 0.14%), Potawatomi (7.3%, a difference of 0.81%), Dominican (7.2%, a difference of 2.7%), Ottawa (7.2%, a difference of 3.0%), and Central American Indian (7.2%, a difference of 3.1%).
| Demographics | Rating | Rank | Ambulatory Disability |
| Immigrants | Armenia | 0.0 /100 | #302 | Tragic 7.0% |
| Africans | 0.0 /100 | #303 | Tragic 7.0% |
| Immigrants | Cabo Verde | 0.0 /100 | #304 | Tragic 7.0% |
| Immigrants | Micronesia | 0.0 /100 | #305 | Tragic 7.0% |
| Iroquois | 0.0 /100 | #306 | Tragic 7.1% |
| Spanish Americans | 0.0 /100 | #307 | Tragic 7.1% |
| Chippewa | 0.0 /100 | #308 | Tragic 7.1% |
| Immigrants | Azores | 0.0 /100 | #309 | Tragic 7.1% |
| Arapaho | 0.0 /100 | #310 | Tragic 7.1% |
| Cree | 0.0 /100 | #311 | Tragic 7.1% |
| Delaware | 0.0 /100 | #312 | Tragic 7.1% |
| Immigrants | Yemen | 0.0 /100 | #313 | Tragic 7.1% |
| Blackfeet | 0.0 /100 | #314 | Tragic 7.1% |
| Shoshone | 0.0 /100 | #315 | Tragic 7.1% |
| Immigrants | Dominican Republic | 0.0 /100 | #316 | Tragic 7.1% |
| Central American Indians | 0.0 /100 | #317 | Tragic 7.2% |
| Ottawa | 0.0 /100 | #318 | Tragic 7.2% |
| Dominicans | 0.0 /100 | #319 | Tragic 7.2% |
| Potawatomi | 0.0 /100 | #320 | Tragic 7.3% |
| Apache | 0.0 /100 | #321 | Tragic 7.4% |
| Osage | 0.0 /100 | #322 | Tragic 7.4% |