Filipino vs Trinidadian and Tobagonian Disability Age Under 5
COMPARE
Filipino
Trinidadian and Tobagonian
Disability Age Under 5
Disability Age Under 5 Comparison
Filipinos
Trinidadians and Tobagonians
1.1%
DISABILITY AGE UNDER 5
99.9/ 100
METRIC RATING
39th/ 347
METRIC RANK
1.1%
DISABILITY AGE UNDER 5
98.6/ 100
METRIC RATING
71st/ 347
METRIC RANK
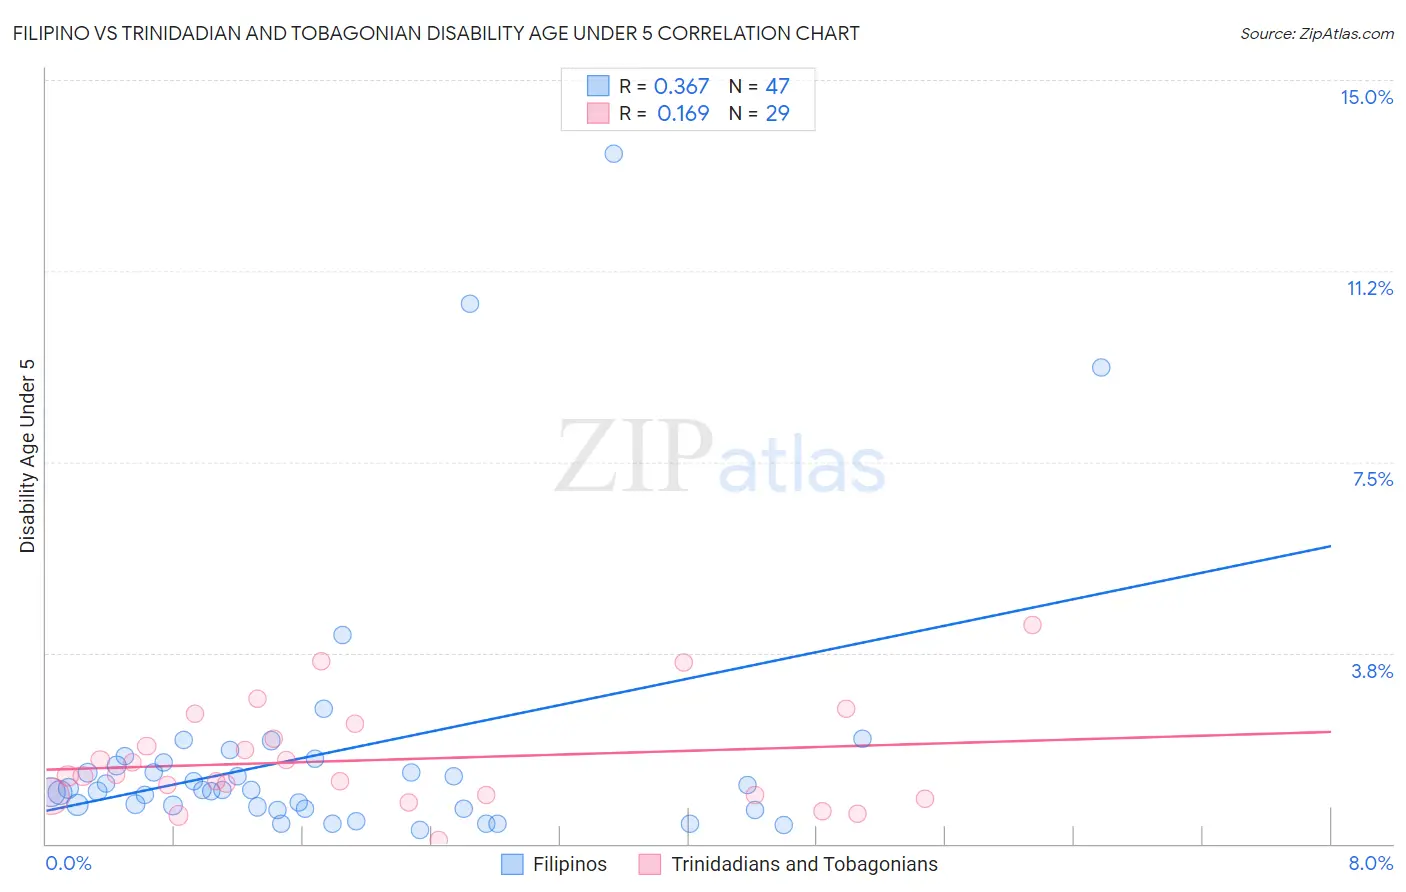
Filipino vs Trinidadian and Tobagonian Disability Age Under 5 Correlation Chart
The statistical analysis conducted on geographies consisting of 154,851,342 people shows a mild positive correlation between the proportion of Filipinos and percentage of population with a disability under the age of 5 in the United States with a correlation coefficient (R) of 0.367 and weighted average of 1.1%. Similarly, the statistical analysis conducted on geographies consisting of 140,023,510 people shows a poor positive correlation between the proportion of Trinidadians and Tobagonians and percentage of population with a disability under the age of 5 in the United States with a correlation coefficient (R) of 0.169 and weighted average of 1.1%, a difference of 6.5%.
Disability Age Under 5 Correlation Summary
| Measurement | Filipino | Trinidadian and Tobagonian |
| Minimum | 0.27% | 0.086% |
| Maximum | 13.6% | 4.3% |
| Range | 13.3% | 4.2% |
| Mean | 1.8% | 1.6% |
| Median | 1.1% | 1.3% |
| Interquartile 25% (IQ1) | 0.69% | 0.94% |
| Interquartile 75% (IQ3) | 1.6% | 2.2% |
| Interquartile Range (IQR) | 0.90% | 1.3% |
| Standard Deviation (Sample) | 2.6% | 1.0% |
| Standard Deviation (Population) | 2.6% | 0.98% |
Similar Demographics by Disability Age Under 5
Demographics Similar to Filipinos by Disability Age Under 5
In terms of disability age under 5, the demographic groups most similar to Filipinos are Immigrants from Albania (1.1%, a difference of 0.33%), Immigrants from Guyana (1.0%, a difference of 0.67%), Thai (1.1%, a difference of 0.74%), Immigrants from India (1.0%, a difference of 0.76%), and Immigrants from Nepal (1.0%, a difference of 0.78%).
| Demographics | Rating | Rank | Disability Age Under 5 |
| Iranians | 99.9 /100 | #32 | Exceptional 1.0% |
| Bolivians | 99.9 /100 | #33 | Exceptional 1.0% |
| Immigrants | Ukraine | 99.9 /100 | #34 | Exceptional 1.0% |
| Barbadians | 99.9 /100 | #35 | Exceptional 1.0% |
| Immigrants | Nepal | 99.9 /100 | #36 | Exceptional 1.0% |
| Immigrants | India | 99.9 /100 | #37 | Exceptional 1.0% |
| Immigrants | Guyana | 99.9 /100 | #38 | Exceptional 1.0% |
| Filipinos | 99.9 /100 | #39 | Exceptional 1.1% |
| Immigrants | Albania | 99.9 /100 | #40 | Exceptional 1.1% |
| Thais | 99.8 /100 | #41 | Exceptional 1.1% |
| Immigrants | Bulgaria | 99.8 /100 | #42 | Exceptional 1.1% |
| Pima | 99.8 /100 | #43 | Exceptional 1.1% |
| Immigrants | Asia | 99.8 /100 | #44 | Exceptional 1.1% |
| Immigrants | Turkey | 99.8 /100 | #45 | Exceptional 1.1% |
| Immigrants | Congo | 99.8 /100 | #46 | Exceptional 1.1% |
Demographics Similar to Trinidadians and Tobagonians by Disability Age Under 5
In terms of disability age under 5, the demographic groups most similar to Trinidadians and Tobagonians are Immigrants from Ecuador (1.1%, a difference of 0.060%), Israeli (1.1%, a difference of 0.15%), Burmese (1.1%, a difference of 0.16%), South African (1.1%, a difference of 0.17%), and Immigrants from Belize (1.1%, a difference of 0.21%).
| Demographics | Rating | Rank | Disability Age Under 5 |
| Egyptians | 98.9 /100 | #64 | Exceptional 1.1% |
| Immigrants | Korea | 98.8 /100 | #65 | Exceptional 1.1% |
| Immigrants | Indonesia | 98.7 /100 | #66 | Exceptional 1.1% |
| Immigrants | Belize | 98.7 /100 | #67 | Exceptional 1.1% |
| South Africans | 98.7 /100 | #68 | Exceptional 1.1% |
| Israelis | 98.7 /100 | #69 | Exceptional 1.1% |
| Immigrants | Ecuador | 98.6 /100 | #70 | Exceptional 1.1% |
| Trinidadians and Tobagonians | 98.6 /100 | #71 | Exceptional 1.1% |
| Burmese | 98.5 /100 | #72 | Exceptional 1.1% |
| Immigrants | Sri Lanka | 98.5 /100 | #73 | Exceptional 1.1% |
| Jordanians | 98.5 /100 | #74 | Exceptional 1.1% |
| Immigrants | Pakistan | 98.4 /100 | #75 | Exceptional 1.1% |
| Immigrants | Burma/Myanmar | 98.2 /100 | #76 | Exceptional 1.1% |
| Immigrants | Denmark | 98.1 /100 | #77 | Exceptional 1.1% |
| West Indians | 98.0 /100 | #78 | Exceptional 1.1% |