Fijian vs Immigrants from Indonesia Hearing Disability
COMPARE
Fijian
Immigrants from Indonesia
Hearing Disability
Hearing Disability Comparison
Fijians
Immigrants from Indonesia
3.5%
HEARING DISABILITY
0.0/ 100
METRIC RATING
272nd/ 347
METRIC RANK
2.8%
HEARING DISABILITY
94.7/ 100
METRIC RATING
103rd/ 347
METRIC RANK
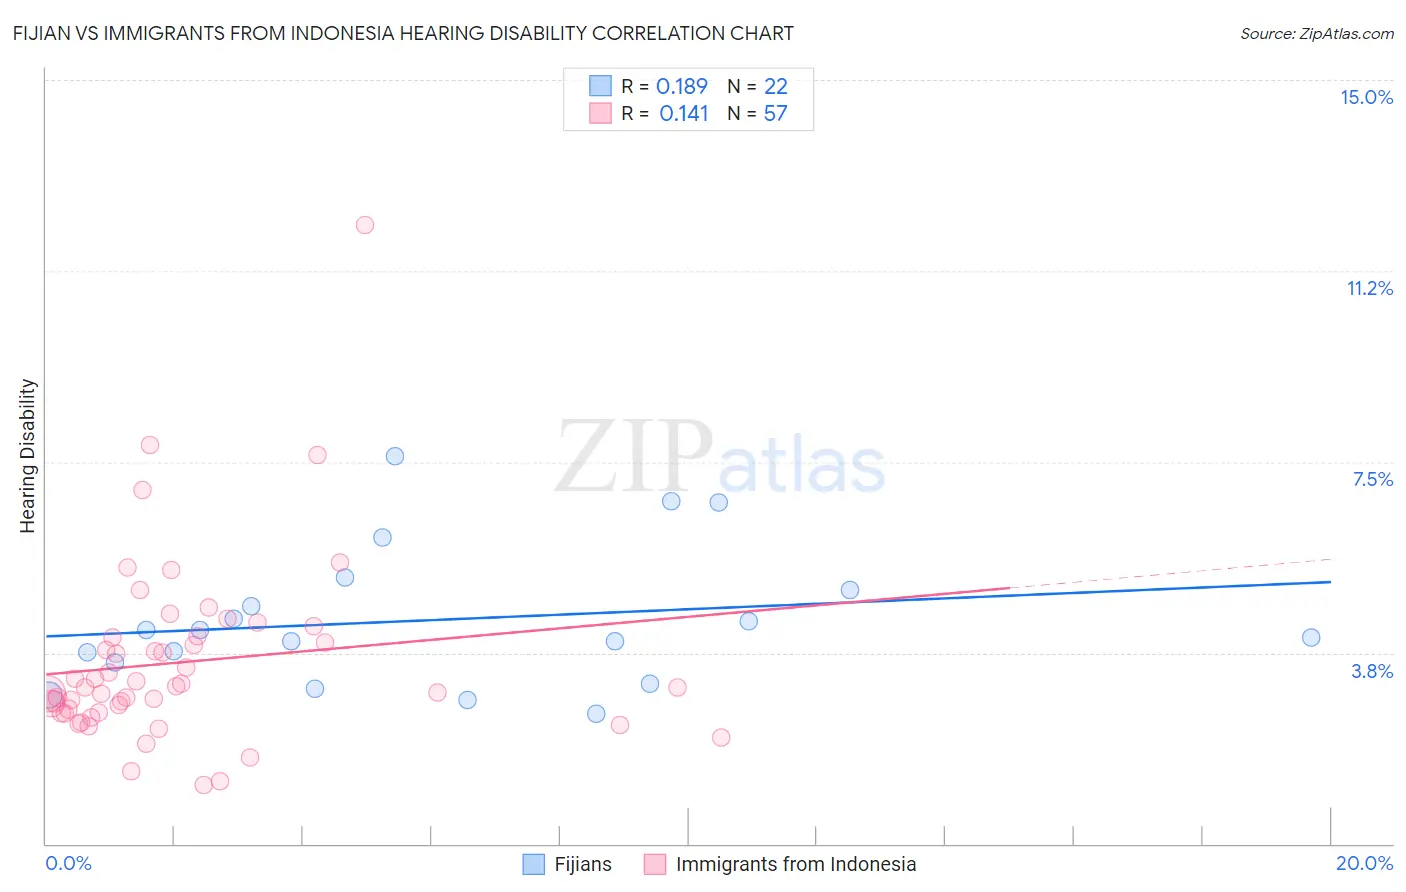
Fijian vs Immigrants from Indonesia Hearing Disability Correlation Chart
The statistical analysis conducted on geographies consisting of 55,946,313 people shows a poor positive correlation between the proportion of Fijians and percentage of population with hearing disability in the United States with a correlation coefficient (R) of 0.189 and weighted average of 3.5%. Similarly, the statistical analysis conducted on geographies consisting of 215,771,622 people shows a poor positive correlation between the proportion of Immigrants from Indonesia and percentage of population with hearing disability in the United States with a correlation coefficient (R) of 0.141 and weighted average of 2.8%, a difference of 26.4%.
Hearing Disability Correlation Summary
| Measurement | Fijian | Immigrants from Indonesia |
| Minimum | 2.5% | 1.2% |
| Maximum | 7.6% | 12.2% |
| Range | 5.1% | 11.0% |
| Mean | 4.4% | 3.6% |
| Median | 4.1% | 3.1% |
| Interquartile 25% (IQ1) | 3.6% | 2.6% |
| Interquartile 75% (IQ3) | 5.0% | 4.1% |
| Interquartile Range (IQR) | 1.4% | 1.5% |
| Standard Deviation (Sample) | 1.4% | 1.8% |
| Standard Deviation (Population) | 1.3% | 1.8% |
Similar Demographics by Hearing Disability
Demographics Similar to Fijians by Hearing Disability
In terms of hearing disability, the demographic groups most similar to Fijians are Puerto Rican (3.5%, a difference of 0.070%), Czech (3.5%, a difference of 0.26%), Swiss (3.5%, a difference of 0.39%), European (3.5%, a difference of 0.52%), and Czechoslovakian (3.6%, a difference of 0.60%).
| Demographics | Rating | Rank | Hearing Disability |
| British | 0.1 /100 | #265 | Tragic 3.5% |
| Belgians | 0.1 /100 | #266 | Tragic 3.5% |
| Canadians | 0.1 /100 | #267 | Tragic 3.5% |
| Spaniards | 0.1 /100 | #268 | Tragic 3.5% |
| Ute | 0.1 /100 | #269 | Tragic 3.5% |
| Europeans | 0.1 /100 | #270 | Tragic 3.5% |
| Czechs | 0.1 /100 | #271 | Tragic 3.5% |
| Fijians | 0.0 /100 | #272 | Tragic 3.5% |
| Puerto Ricans | 0.0 /100 | #273 | Tragic 3.5% |
| Swiss | 0.0 /100 | #274 | Tragic 3.5% |
| Czechoslovakians | 0.0 /100 | #275 | Tragic 3.6% |
| Danes | 0.0 /100 | #276 | Tragic 3.6% |
| Immigrants | Nonimmigrants | 0.0 /100 | #277 | Tragic 3.6% |
| Basques | 0.0 /100 | #278 | Tragic 3.6% |
| Slovaks | 0.0 /100 | #279 | Tragic 3.6% |
Demographics Similar to Immigrants from Indonesia by Hearing Disability
In terms of hearing disability, the demographic groups most similar to Immigrants from Indonesia are Taiwanese (2.8%, a difference of 0.050%), Immigrants from Spain (2.8%, a difference of 0.060%), Immigrants from Eastern Africa (2.8%, a difference of 0.12%), Immigrants from Guatemala (2.8%, a difference of 0.17%), and Immigrants from Honduras (2.8%, a difference of 0.21%).
| Demographics | Rating | Rank | Hearing Disability |
| Immigrants | Somalia | 95.5 /100 | #96 | Exceptional 2.8% |
| Immigrants | Afghanistan | 95.3 /100 | #97 | Exceptional 2.8% |
| Immigrants | Honduras | 95.1 /100 | #98 | Exceptional 2.8% |
| Immigrants | Guatemala | 95.1 /100 | #99 | Exceptional 2.8% |
| Immigrants | Eastern Africa | 95.0 /100 | #100 | Exceptional 2.8% |
| Immigrants | Spain | 94.9 /100 | #101 | Exceptional 2.8% |
| Taiwanese | 94.8 /100 | #102 | Exceptional 2.8% |
| Immigrants | Indonesia | 94.7 /100 | #103 | Exceptional 2.8% |
| Burmese | 94.2 /100 | #104 | Exceptional 2.8% |
| Moroccans | 93.9 /100 | #105 | Exceptional 2.8% |
| Hondurans | 93.4 /100 | #106 | Exceptional 2.8% |
| Immigrants | Chile | 93.4 /100 | #107 | Exceptional 2.8% |
| Guatemalans | 93.2 /100 | #108 | Exceptional 2.8% |
| Turks | 93.0 /100 | #109 | Exceptional 2.8% |
| Cypriots | 92.9 /100 | #110 | Exceptional 2.8% |