Fijian vs Norwegian Hearing Disability
COMPARE
Fijian
Norwegian
Hearing Disability
Hearing Disability Comparison
Fijians
Norwegians
3.5%
HEARING DISABILITY
0.0/ 100
METRIC RATING
272nd/ 347
METRIC RANK
3.7%
HEARING DISABILITY
0.0/ 100
METRIC RATING
293rd/ 347
METRIC RANK
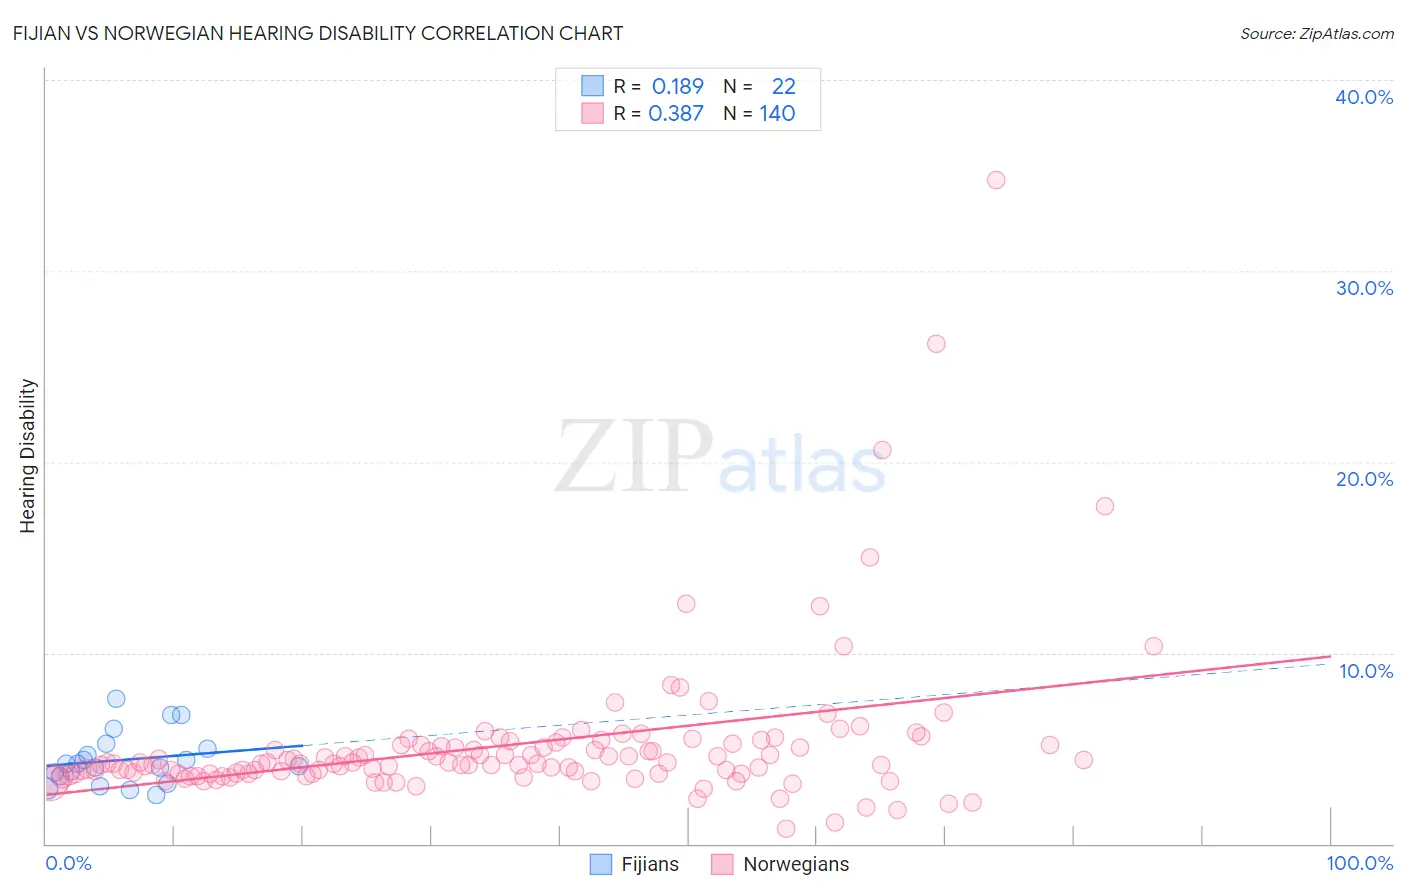
Fijian vs Norwegian Hearing Disability Correlation Chart
The statistical analysis conducted on geographies consisting of 55,946,313 people shows a poor positive correlation between the proportion of Fijians and percentage of population with hearing disability in the United States with a correlation coefficient (R) of 0.189 and weighted average of 3.5%. Similarly, the statistical analysis conducted on geographies consisting of 532,928,567 people shows a mild positive correlation between the proportion of Norwegians and percentage of population with hearing disability in the United States with a correlation coefficient (R) of 0.387 and weighted average of 3.7%, a difference of 4.5%.
Hearing Disability Correlation Summary
| Measurement | Fijian | Norwegian |
| Minimum | 2.5% | 0.76% |
| Maximum | 7.6% | 34.8% |
| Range | 5.1% | 34.0% |
| Mean | 4.4% | 5.2% |
| Median | 4.1% | 4.2% |
| Interquartile 25% (IQ1) | 3.6% | 3.7% |
| Interquartile 75% (IQ3) | 5.0% | 5.1% |
| Interquartile Range (IQR) | 1.4% | 1.5% |
| Standard Deviation (Sample) | 1.4% | 4.0% |
| Standard Deviation (Population) | 1.3% | 4.0% |
Similar Demographics by Hearing Disability
Demographics Similar to Fijians by Hearing Disability
In terms of hearing disability, the demographic groups most similar to Fijians are Puerto Rican (3.5%, a difference of 0.070%), Czech (3.5%, a difference of 0.26%), Swiss (3.5%, a difference of 0.39%), European (3.5%, a difference of 0.52%), and Czechoslovakian (3.6%, a difference of 0.60%).
| Demographics | Rating | Rank | Hearing Disability |
| British | 0.1 /100 | #265 | Tragic 3.5% |
| Belgians | 0.1 /100 | #266 | Tragic 3.5% |
| Canadians | 0.1 /100 | #267 | Tragic 3.5% |
| Spaniards | 0.1 /100 | #268 | Tragic 3.5% |
| Ute | 0.1 /100 | #269 | Tragic 3.5% |
| Europeans | 0.1 /100 | #270 | Tragic 3.5% |
| Czechs | 0.1 /100 | #271 | Tragic 3.5% |
| Fijians | 0.0 /100 | #272 | Tragic 3.5% |
| Puerto Ricans | 0.0 /100 | #273 | Tragic 3.5% |
| Swiss | 0.0 /100 | #274 | Tragic 3.5% |
| Czechoslovakians | 0.0 /100 | #275 | Tragic 3.6% |
| Danes | 0.0 /100 | #276 | Tragic 3.6% |
| Immigrants | Nonimmigrants | 0.0 /100 | #277 | Tragic 3.6% |
| Basques | 0.0 /100 | #278 | Tragic 3.6% |
| Slovaks | 0.0 /100 | #279 | Tragic 3.6% |
Demographics Similar to Norwegians by Hearing Disability
In terms of hearing disability, the demographic groups most similar to Norwegians are Native Hawaiian (3.7%, a difference of 0.060%), Finnish (3.7%, a difference of 0.12%), White/Caucasian (3.7%, a difference of 0.13%), Iroquois (3.7%, a difference of 0.24%), and Chinese (3.7%, a difference of 0.27%).
| Demographics | Rating | Rank | Hearing Disability |
| Delaware | 0.0 /100 | #286 | Tragic 3.6% |
| Spanish | 0.0 /100 | #287 | Tragic 3.7% |
| Irish | 0.0 /100 | #288 | Tragic 3.7% |
| Chinese | 0.0 /100 | #289 | Tragic 3.7% |
| Whites/Caucasians | 0.0 /100 | #290 | Tragic 3.7% |
| Finns | 0.0 /100 | #291 | Tragic 3.7% |
| Native Hawaiians | 0.0 /100 | #292 | Tragic 3.7% |
| Norwegians | 0.0 /100 | #293 | Tragic 3.7% |
| Iroquois | 0.0 /100 | #294 | Tragic 3.7% |
| Welsh | 0.0 /100 | #295 | Tragic 3.7% |
| Pima | 0.0 /100 | #296 | Tragic 3.7% |
| Immigrants | Azores | 0.0 /100 | #297 | Tragic 3.7% |
| Celtics | 0.0 /100 | #298 | Tragic 3.7% |
| Germans | 0.0 /100 | #299 | Tragic 3.7% |
| Scottish | 0.0 /100 | #300 | Tragic 3.7% |