Immigrants from Bulgaria vs Immigrants from Nigeria Disability Age Under 5
COMPARE
Immigrants from Bulgaria
Immigrants from Nigeria
Disability Age Under 5
Disability Age Under 5 Comparison
Immigrants from Bulgaria
Immigrants from Nigeria
1.1%
DISABILITY AGE UNDER 5
99.8/ 100
METRIC RATING
42nd/ 347
METRIC RANK
1.2%
DISABILITY AGE UNDER 5
50.0/ 100
METRIC RATING
175th/ 347
METRIC RANK
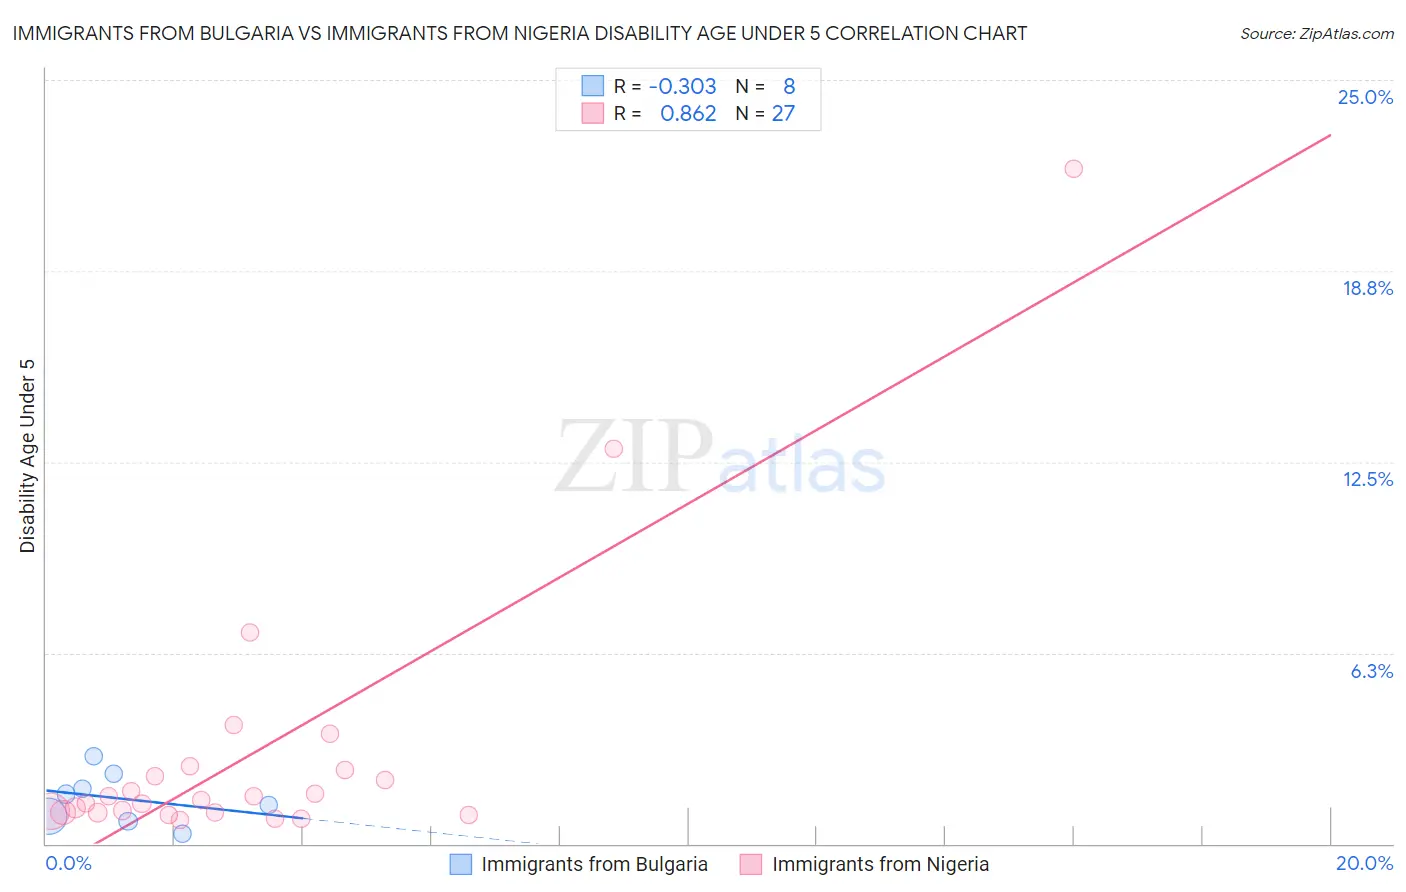
Immigrants from Bulgaria vs Immigrants from Nigeria Disability Age Under 5 Correlation Chart
The statistical analysis conducted on geographies consisting of 114,268,048 people shows a mild negative correlation between the proportion of Immigrants from Bulgaria and percentage of population with a disability under the age of 5 in the United States with a correlation coefficient (R) of -0.303 and weighted average of 1.1%. Similarly, the statistical analysis conducted on geographies consisting of 173,767,692 people shows a very strong positive correlation between the proportion of Immigrants from Nigeria and percentage of population with a disability under the age of 5 in the United States with a correlation coefficient (R) of 0.862 and weighted average of 1.2%, a difference of 16.9%.
Disability Age Under 5 Correlation Summary
| Measurement | Immigrants from Bulgaria | Immigrants from Nigeria |
| Minimum | 0.31% | 0.78% |
| Maximum | 2.9% | 22.1% |
| Range | 2.6% | 21.3% |
| Mean | 1.5% | 3.0% |
| Median | 1.5% | 1.4% |
| Interquartile 25% (IQ1) | 0.81% | 1.0% |
| Interquartile 75% (IQ3) | 2.0% | 2.4% |
| Interquartile Range (IQR) | 1.2% | 1.4% |
| Standard Deviation (Sample) | 0.84% | 4.6% |
| Standard Deviation (Population) | 0.79% | 4.5% |
Similar Demographics by Disability Age Under 5
Demographics Similar to Immigrants from Bulgaria by Disability Age Under 5
In terms of disability age under 5, the demographic groups most similar to Immigrants from Bulgaria are Pima (1.1%, a difference of 0.010%), Thai (1.1%, a difference of 0.10%), Immigrants from Asia (1.1%, a difference of 0.11%), Immigrants from Turkey (1.1%, a difference of 0.33%), and Immigrants from Albania (1.1%, a difference of 0.51%).
| Demographics | Rating | Rank | Disability Age Under 5 |
| Barbadians | 99.9 /100 | #35 | Exceptional 1.0% |
| Immigrants | Nepal | 99.9 /100 | #36 | Exceptional 1.0% |
| Immigrants | India | 99.9 /100 | #37 | Exceptional 1.0% |
| Immigrants | Guyana | 99.9 /100 | #38 | Exceptional 1.0% |
| Filipinos | 99.9 /100 | #39 | Exceptional 1.1% |
| Immigrants | Albania | 99.9 /100 | #40 | Exceptional 1.1% |
| Thais | 99.8 /100 | #41 | Exceptional 1.1% |
| Immigrants | Bulgaria | 99.8 /100 | #42 | Exceptional 1.1% |
| Pima | 99.8 /100 | #43 | Exceptional 1.1% |
| Immigrants | Asia | 99.8 /100 | #44 | Exceptional 1.1% |
| Immigrants | Turkey | 99.8 /100 | #45 | Exceptional 1.1% |
| Immigrants | Congo | 99.8 /100 | #46 | Exceptional 1.1% |
| Immigrants | Sweden | 99.8 /100 | #47 | Exceptional 1.1% |
| Immigrants | Singapore | 99.7 /100 | #48 | Exceptional 1.1% |
| Immigrants | Russia | 99.7 /100 | #49 | Exceptional 1.1% |
Demographics Similar to Immigrants from Nigeria by Disability Age Under 5
In terms of disability age under 5, the demographic groups most similar to Immigrants from Nigeria are Immigrants from Latvia (1.2%, a difference of 0.0%), Immigrants from Ireland (1.2%, a difference of 0.030%), Crow (1.2%, a difference of 0.090%), Immigrants from Kenya (1.2%, a difference of 0.13%), and Comanche (1.2%, a difference of 0.22%).
| Demographics | Rating | Rank | Disability Age Under 5 |
| Sierra Leoneans | 59.1 /100 | #168 | Average 1.2% |
| Immigrants | Uruguay | 59.0 /100 | #169 | Average 1.2% |
| Immigrants | Jamaica | 58.8 /100 | #170 | Average 1.2% |
| Guamanians/Chamorros | 57.8 /100 | #171 | Average 1.2% |
| Crow | 51.0 /100 | #172 | Average 1.2% |
| Immigrants | Ireland | 50.3 /100 | #173 | Average 1.2% |
| Immigrants | Latvia | 50.0 /100 | #174 | Average 1.2% |
| Immigrants | Nigeria | 50.0 /100 | #175 | Average 1.2% |
| Immigrants | Kenya | 48.6 /100 | #176 | Average 1.2% |
| Comanche | 47.5 /100 | #177 | Average 1.2% |
| Venezuelans | 47.1 /100 | #178 | Average 1.2% |
| Immigrants | Bahamas | 45.2 /100 | #179 | Average 1.2% |
| Immigrants | Mexico | 44.4 /100 | #180 | Average 1.2% |
| Macedonians | 43.7 /100 | #181 | Average 1.2% |
| Immigrants | Peru | 43.7 /100 | #181 | Average 1.2% |