Fijian vs Immigrants from Venezuela Male Disability
COMPARE
Fijian
Immigrants from Venezuela
Male Disability
Male Disability Comparison
Fijians
Immigrants from Venezuela
12.6%
MALE DISABILITY
0.0/ 100
METRIC RATING
275th/ 347
METRIC RANK
10.0%
MALE DISABILITY
100.0/ 100
METRIC RATING
22nd/ 347
METRIC RANK
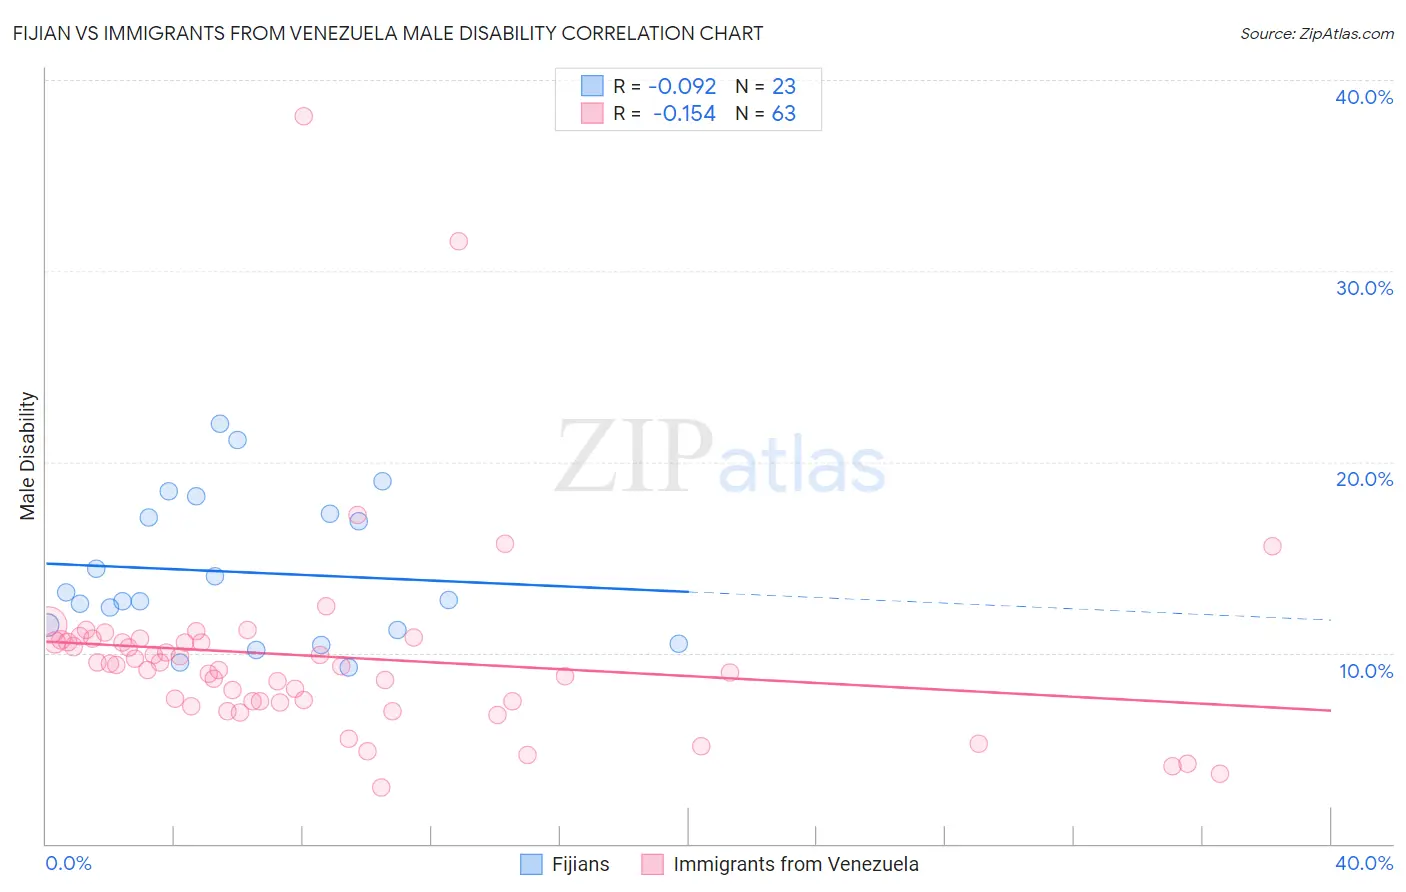
Fijian vs Immigrants from Venezuela Male Disability Correlation Chart
The statistical analysis conducted on geographies consisting of 55,947,896 people shows a slight negative correlation between the proportion of Fijians and percentage of males with a disability in the United States with a correlation coefficient (R) of -0.092 and weighted average of 12.6%. Similarly, the statistical analysis conducted on geographies consisting of 287,855,210 people shows a poor negative correlation between the proportion of Immigrants from Venezuela and percentage of males with a disability in the United States with a correlation coefficient (R) of -0.154 and weighted average of 10.0%, a difference of 25.6%.
Male Disability Correlation Summary
| Measurement | Fijian | Immigrants from Venezuela |
| Minimum | 9.2% | 2.9% |
| Maximum | 22.0% | 38.1% |
| Range | 12.7% | 35.2% |
| Mean | 14.2% | 9.8% |
| Median | 12.8% | 9.3% |
| Interquartile 25% (IQ1) | 11.2% | 7.4% |
| Interquartile 75% (IQ3) | 17.3% | 10.7% |
| Interquartile Range (IQR) | 6.0% | 3.2% |
| Standard Deviation (Sample) | 3.8% | 5.3% |
| Standard Deviation (Population) | 3.7% | 5.3% |
Similar Demographics by Male Disability
Demographics Similar to Fijians by Male Disability
In terms of male disability, the demographic groups most similar to Fijians are African (12.6%, a difference of 0.050%), Hopi (12.5%, a difference of 0.35%), Finnish (12.6%, a difference of 0.37%), Native Hawaiian (12.5%, a difference of 0.68%), and Hmong (12.5%, a difference of 0.75%).
| Demographics | Rating | Rank | Male Disability |
| Portuguese | 0.1 /100 | #268 | Tragic 12.3% |
| Czechoslovakians | 0.1 /100 | #269 | Tragic 12.3% |
| Spaniards | 0.1 /100 | #270 | Tragic 12.3% |
| Scandinavians | 0.1 /100 | #271 | Tragic 12.3% |
| Hmong | 0.0 /100 | #272 | Tragic 12.5% |
| Native Hawaiians | 0.0 /100 | #273 | Tragic 12.5% |
| Hopi | 0.0 /100 | #274 | Tragic 12.5% |
| Fijians | 0.0 /100 | #275 | Tragic 12.6% |
| Africans | 0.0 /100 | #276 | Tragic 12.6% |
| Finns | 0.0 /100 | #277 | Tragic 12.6% |
| Central American Indians | 0.0 /100 | #278 | Tragic 12.7% |
| Slovaks | 0.0 /100 | #279 | Tragic 12.7% |
| Dutch | 0.0 /100 | #280 | Tragic 12.7% |
| Sioux | 0.0 /100 | #281 | Tragic 12.7% |
| Irish | 0.0 /100 | #282 | Tragic 12.7% |
Demographics Similar to Immigrants from Venezuela by Male Disability
In terms of male disability, the demographic groups most similar to Immigrants from Venezuela are Cypriot (10.0%, a difference of 0.090%), Immigrants from Asia (10.0%, a difference of 0.23%), Burmese (10.0%, a difference of 0.29%), Asian (10.0%, a difference of 0.39%), and Immigrants from Malaysia (10.0%, a difference of 0.41%).
| Demographics | Rating | Rank | Male Disability |
| Indians (Asian) | 100.0 /100 | #15 | Exceptional 9.7% |
| Okinawans | 100.0 /100 | #16 | Exceptional 9.8% |
| Immigrants | Korea | 100.0 /100 | #17 | Exceptional 9.8% |
| Immigrants | Pakistan | 100.0 /100 | #18 | Exceptional 9.8% |
| Immigrants | Sri Lanka | 100.0 /100 | #19 | Exceptional 10.0% |
| Asians | 100.0 /100 | #20 | Exceptional 10.0% |
| Burmese | 100.0 /100 | #21 | Exceptional 10.0% |
| Immigrants | Venezuela | 100.0 /100 | #22 | Exceptional 10.0% |
| Cypriots | 100.0 /100 | #23 | Exceptional 10.0% |
| Immigrants | Asia | 100.0 /100 | #24 | Exceptional 10.0% |
| Immigrants | Malaysia | 99.9 /100 | #25 | Exceptional 10.0% |
| Paraguayans | 99.9 /100 | #26 | Exceptional 10.1% |
| Egyptians | 99.9 /100 | #27 | Exceptional 10.1% |
| Vietnamese | 99.9 /100 | #28 | Exceptional 10.1% |
| Venezuelans | 99.9 /100 | #29 | Exceptional 10.1% |