Fijian vs Immigrants from Europe Male Disability
COMPARE
Fijian
Immigrants from Europe
Male Disability
Male Disability Comparison
Fijians
Immigrants from Europe
12.6%
MALE DISABILITY
0.0/ 100
METRIC RATING
275th/ 347
METRIC RANK
11.0%
MALE DISABILITY
82.0/ 100
METRIC RATING
137th/ 347
METRIC RANK
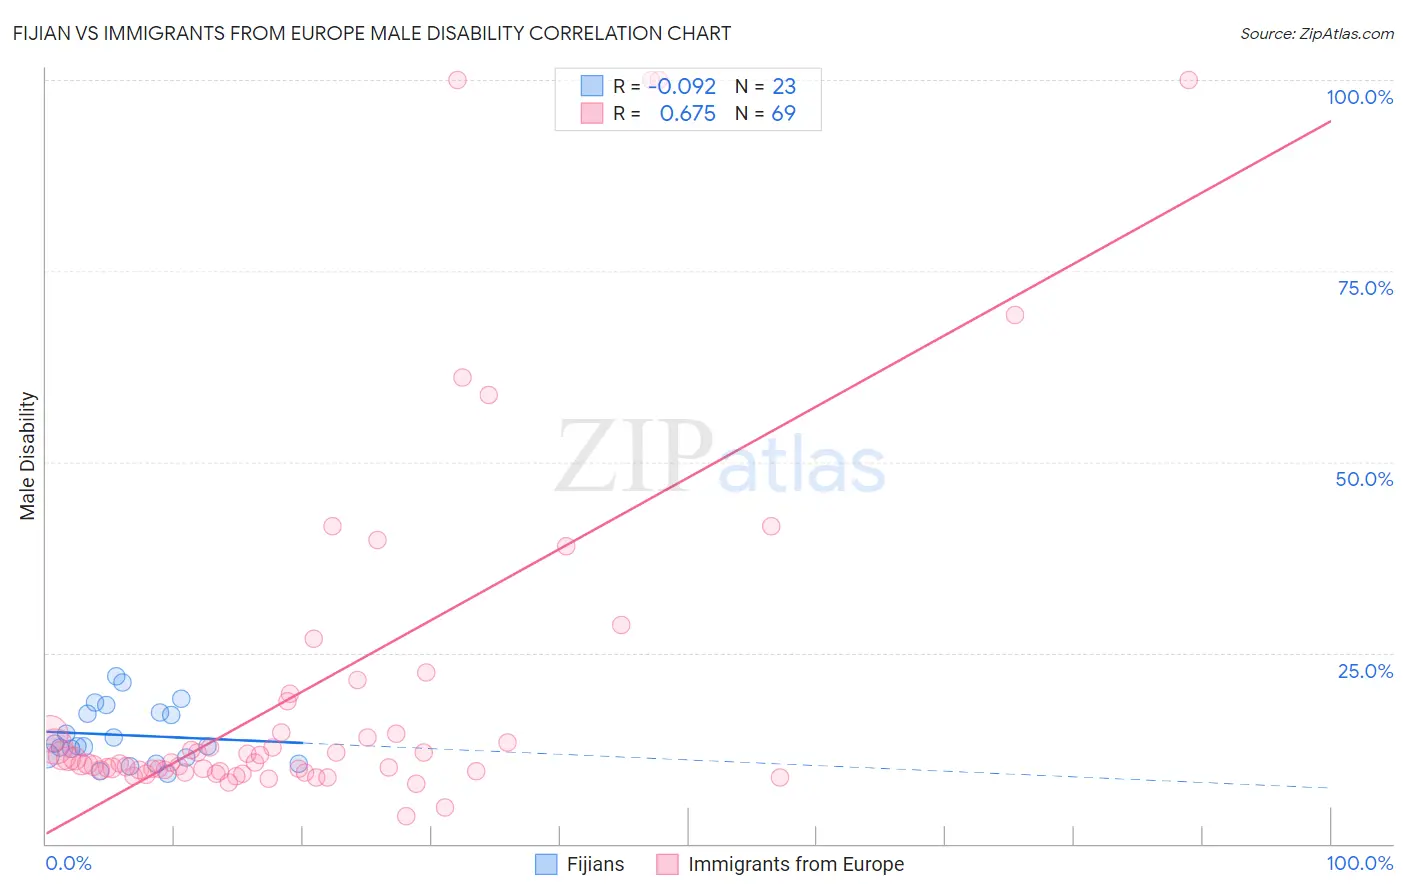
Fijian vs Immigrants from Europe Male Disability Correlation Chart
The statistical analysis conducted on geographies consisting of 55,947,896 people shows a slight negative correlation between the proportion of Fijians and percentage of males with a disability in the United States with a correlation coefficient (R) of -0.092 and weighted average of 12.6%. Similarly, the statistical analysis conducted on geographies consisting of 547,240,570 people shows a significant positive correlation between the proportion of Immigrants from Europe and percentage of males with a disability in the United States with a correlation coefficient (R) of 0.675 and weighted average of 11.0%, a difference of 14.4%.
Male Disability Correlation Summary
| Measurement | Fijian | Immigrants from Europe |
| Minimum | 9.2% | 3.6% |
| Maximum | 22.0% | 100.0% |
| Range | 12.7% | 96.4% |
| Mean | 14.2% | 20.7% |
| Median | 12.8% | 10.7% |
| Interquartile 25% (IQ1) | 11.2% | 9.6% |
| Interquartile 75% (IQ3) | 17.3% | 16.6% |
| Interquartile Range (IQR) | 6.0% | 7.0% |
| Standard Deviation (Sample) | 3.8% | 23.7% |
| Standard Deviation (Population) | 3.7% | 23.5% |
Similar Demographics by Male Disability
Demographics Similar to Fijians by Male Disability
In terms of male disability, the demographic groups most similar to Fijians are African (12.6%, a difference of 0.050%), Hopi (12.5%, a difference of 0.35%), Finnish (12.6%, a difference of 0.37%), Native Hawaiian (12.5%, a difference of 0.68%), and Hmong (12.5%, a difference of 0.75%).
| Demographics | Rating | Rank | Male Disability |
| Portuguese | 0.1 /100 | #268 | Tragic 12.3% |
| Czechoslovakians | 0.1 /100 | #269 | Tragic 12.3% |
| Spaniards | 0.1 /100 | #270 | Tragic 12.3% |
| Scandinavians | 0.1 /100 | #271 | Tragic 12.3% |
| Hmong | 0.0 /100 | #272 | Tragic 12.5% |
| Native Hawaiians | 0.0 /100 | #273 | Tragic 12.5% |
| Hopi | 0.0 /100 | #274 | Tragic 12.5% |
| Fijians | 0.0 /100 | #275 | Tragic 12.6% |
| Africans | 0.0 /100 | #276 | Tragic 12.6% |
| Finns | 0.0 /100 | #277 | Tragic 12.6% |
| Central American Indians | 0.0 /100 | #278 | Tragic 12.7% |
| Slovaks | 0.0 /100 | #279 | Tragic 12.7% |
| Dutch | 0.0 /100 | #280 | Tragic 12.7% |
| Sioux | 0.0 /100 | #281 | Tragic 12.7% |
| Irish | 0.0 /100 | #282 | Tragic 12.7% |
Demographics Similar to Immigrants from Europe by Male Disability
In terms of male disability, the demographic groups most similar to Immigrants from Europe are Nigerian (11.0%, a difference of 0.010%), South African (11.0%, a difference of 0.030%), Immigrants from Italy (11.0%, a difference of 0.040%), Arab (11.0%, a difference of 0.050%), and Immigrants from Sudan (11.0%, a difference of 0.050%).
| Demographics | Rating | Rank | Male Disability |
| Brazilians | 85.4 /100 | #130 | Excellent 10.9% |
| Macedonians | 84.2 /100 | #131 | Excellent 11.0% |
| Immigrants | Fiji | 84.0 /100 | #132 | Excellent 11.0% |
| Ugandans | 83.9 /100 | #133 | Excellent 11.0% |
| Bhutanese | 83.4 /100 | #134 | Excellent 11.0% |
| Trinidadians and Tobagonians | 83.3 /100 | #135 | Excellent 11.0% |
| Immigrants | Costa Rica | 82.8 /100 | #136 | Excellent 11.0% |
| Immigrants | Europe | 82.0 /100 | #137 | Excellent 11.0% |
| Nigerians | 81.9 /100 | #138 | Excellent 11.0% |
| South Africans | 81.7 /100 | #139 | Excellent 11.0% |
| Immigrants | Italy | 81.5 /100 | #140 | Excellent 11.0% |
| Arabs | 81.5 /100 | #141 | Excellent 11.0% |
| Immigrants | Sudan | 81.5 /100 | #142 | Excellent 11.0% |
| Moroccans | 80.7 /100 | #143 | Excellent 11.0% |
| Kenyans | 78.1 /100 | #144 | Good 11.0% |