Chickasaw vs Iraqi Disability Age 5 to 17
COMPARE
Chickasaw
Iraqi
Disability Age 5 to 17
Disability Age 5 to 17 Comparison
Chickasaw
Iraqis
6.8%
DISABILITY AGE 5 TO 17
0.0/ 100
METRIC RATING
336th/ 347
METRIC RANK
5.6%
DISABILITY AGE 5 TO 17
56.0/ 100
METRIC RATING
168th/ 347
METRIC RANK
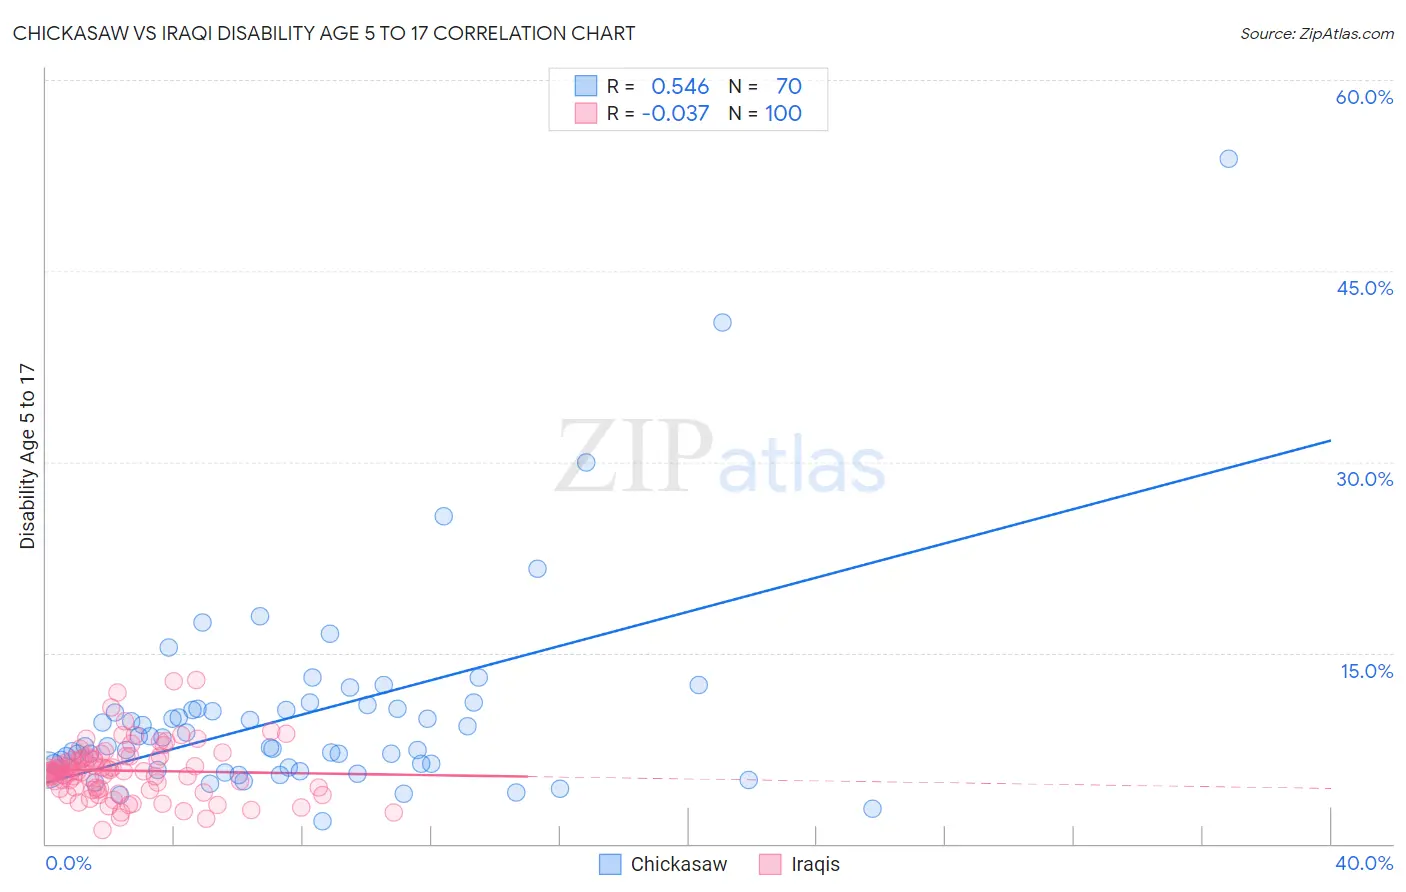
Chickasaw vs Iraqi Disability Age 5 to 17 Correlation Chart
The statistical analysis conducted on geographies consisting of 147,149,878 people shows a substantial positive correlation between the proportion of Chickasaw and percentage of population with a disability between the ages 5 and 17 in the United States with a correlation coefficient (R) of 0.546 and weighted average of 6.8%. Similarly, the statistical analysis conducted on geographies consisting of 170,075,057 people shows no correlation between the proportion of Iraqis and percentage of population with a disability between the ages 5 and 17 in the United States with a correlation coefficient (R) of -0.037 and weighted average of 5.6%, a difference of 22.5%.
Disability Age 5 to 17 Correlation Summary
| Measurement | Chickasaw | Iraqi |
| Minimum | 1.8% | 1.0% |
| Maximum | 53.8% | 12.9% |
| Range | 52.1% | 11.9% |
| Mean | 10.2% | 5.7% |
| Median | 8.0% | 5.7% |
| Interquartile 25% (IQ1) | 6.0% | 4.3% |
| Interquartile 75% (IQ3) | 10.6% | 6.7% |
| Interquartile Range (IQR) | 4.7% | 2.4% |
| Standard Deviation (Sample) | 8.1% | 2.2% |
| Standard Deviation (Population) | 8.1% | 2.2% |
Similar Demographics by Disability Age 5 to 17
Demographics Similar to Chickasaw by Disability Age 5 to 17
In terms of disability age 5 to 17, the demographic groups most similar to Chickasaw are Creek (6.9%, a difference of 0.43%), Ottawa (6.8%, a difference of 0.50%), Iroquois (6.9%, a difference of 0.68%), Choctaw (6.9%, a difference of 1.0%), and Seminole (6.8%, a difference of 1.2%).
| Demographics | Rating | Rank | Disability Age 5 to 17 |
| Blackfeet | 0.0 /100 | #329 | Tragic 6.6% |
| Dutch West Indians | 0.0 /100 | #330 | Tragic 6.7% |
| French Canadians | 0.0 /100 | #331 | Tragic 6.7% |
| Immigrants | Azores | 0.0 /100 | #332 | Tragic 6.7% |
| Blacks/African Americans | 0.0 /100 | #333 | Tragic 6.8% |
| Seminole | 0.0 /100 | #334 | Tragic 6.8% |
| Ottawa | 0.0 /100 | #335 | Tragic 6.8% |
| Chickasaw | 0.0 /100 | #336 | Tragic 6.8% |
| Creek | 0.0 /100 | #337 | Tragic 6.9% |
| Iroquois | 0.0 /100 | #338 | Tragic 6.9% |
| Choctaw | 0.0 /100 | #339 | Tragic 6.9% |
| Cherokee | 0.0 /100 | #340 | Tragic 6.9% |
| Cape Verdeans | 0.0 /100 | #341 | Tragic 7.0% |
| Chippewa | 0.0 /100 | #342 | Tragic 7.1% |
| Immigrants | Cabo Verde | 0.0 /100 | #343 | Tragic 7.1% |
Demographics Similar to Iraqis by Disability Age 5 to 17
In terms of disability age 5 to 17, the demographic groups most similar to Iraqis are Immigrants from Norway (5.6%, a difference of 0.020%), Serbian (5.6%, a difference of 0.10%), Immigrants from Iraq (5.6%, a difference of 0.11%), Immigrants from Burma/Myanmar (5.6%, a difference of 0.17%), and Greek (5.6%, a difference of 0.23%).
| Demographics | Rating | Rank | Disability Age 5 to 17 |
| Immigrants | Saudi Arabia | 69.1 /100 | #161 | Good 5.5% |
| Zimbabweans | 67.2 /100 | #162 | Good 5.5% |
| Immigrants | Southern Europe | 64.0 /100 | #163 | Good 5.6% |
| Immigrants | Scotland | 61.9 /100 | #164 | Good 5.6% |
| Lebanese | 61.4 /100 | #165 | Good 5.6% |
| Greeks | 60.6 /100 | #166 | Good 5.6% |
| Immigrants | Burma/Myanmar | 59.3 /100 | #167 | Average 5.6% |
| Iraqis | 56.0 /100 | #168 | Average 5.6% |
| Immigrants | Norway | 55.7 /100 | #169 | Average 5.6% |
| Serbians | 54.0 /100 | #170 | Average 5.6% |
| Immigrants | Iraq | 53.9 /100 | #171 | Average 5.6% |
| Ukrainians | 51.5 /100 | #172 | Average 5.6% |
| Uruguayans | 51.0 /100 | #173 | Average 5.6% |
| Costa Ricans | 50.0 /100 | #174 | Average 5.6% |
| Shoshone | 49.4 /100 | #175 | Average 5.6% |