European vs Immigrants from Ireland Female Disability
COMPARE
European
Immigrants from Ireland
Female Disability
Female Disability Comparison
Europeans
Immigrants from Ireland
12.4%
FEMALE DISABILITY
12.1/ 100
METRIC RATING
219th/ 347
METRIC RANK
11.5%
FEMALE DISABILITY
99.8/ 100
METRIC RATING
71st/ 347
METRIC RANK
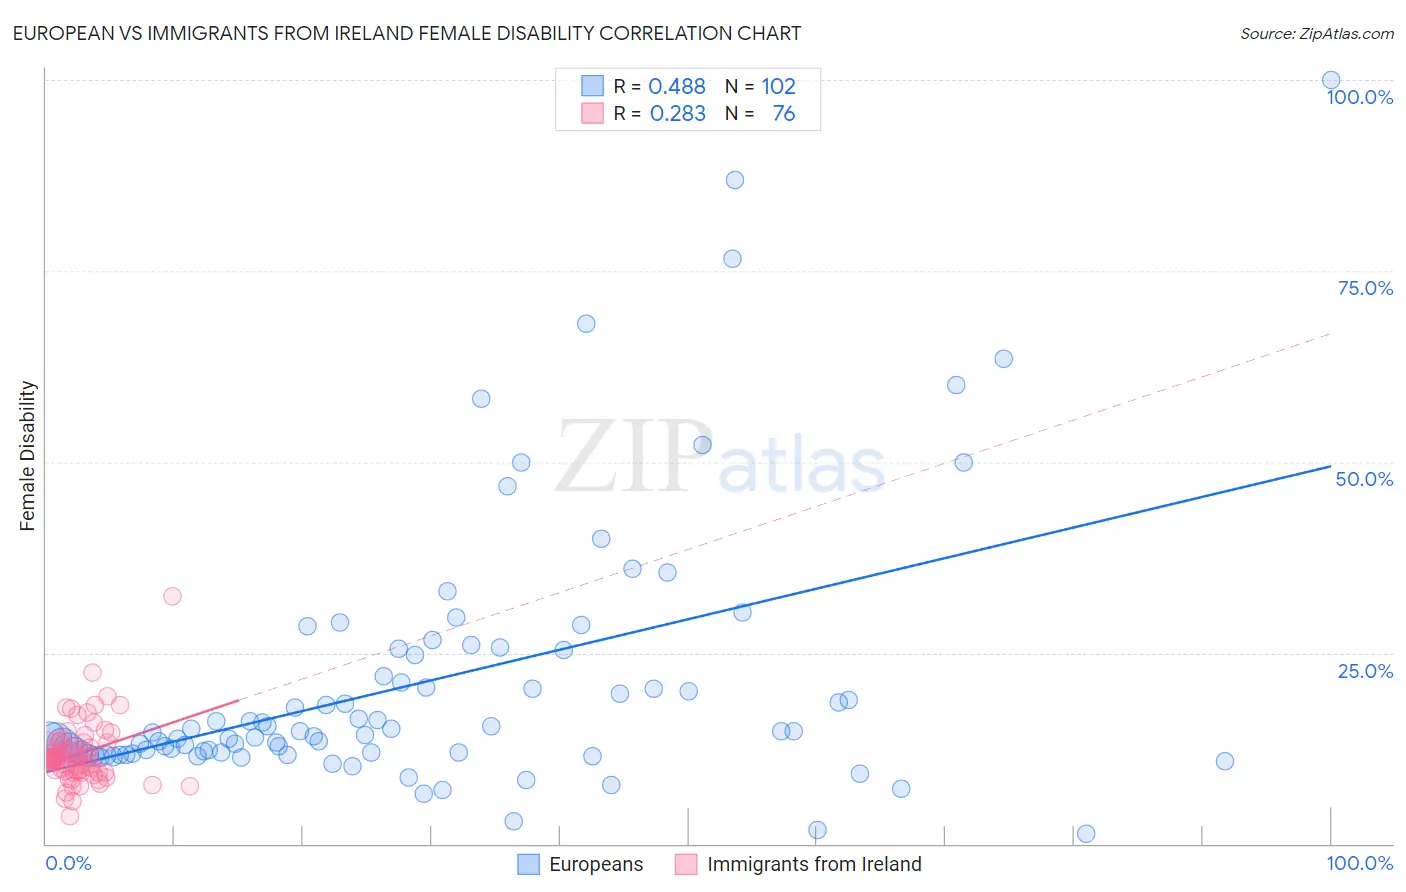
European vs Immigrants from Ireland Female Disability Correlation Chart
The statistical analysis conducted on geographies consisting of 561,578,477 people shows a moderate positive correlation between the proportion of Europeans and percentage of females with a disability in the United States with a correlation coefficient (R) of 0.488 and weighted average of 12.4%. Similarly, the statistical analysis conducted on geographies consisting of 240,772,628 people shows a weak positive correlation between the proportion of Immigrants from Ireland and percentage of females with a disability in the United States with a correlation coefficient (R) of 0.283 and weighted average of 11.5%, a difference of 8.2%.
Female Disability Correlation Summary
| Measurement | European | Immigrants from Ireland |
| Minimum | 1.3% | 3.5% |
| Maximum | 100.0% | 32.4% |
| Range | 98.8% | 28.9% |
| Mean | 21.2% | 11.7% |
| Median | 14.4% | 11.1% |
| Interquartile 25% (IQ1) | 11.9% | 9.5% |
| Interquartile 75% (IQ3) | 24.8% | 12.9% |
| Interquartile Range (IQR) | 12.9% | 3.4% |
| Standard Deviation (Sample) | 17.6% | 4.1% |
| Standard Deviation (Population) | 17.5% | 4.1% |
Similar Demographics by Female Disability
Demographics Similar to Europeans by Female Disability
In terms of female disability, the demographic groups most similar to Europeans are Immigrants from Bahamas (12.4%, a difference of 0.030%), British (12.4%, a difference of 0.050%), Bahamian (12.4%, a difference of 0.090%), Immigrants from Burma/Myanmar (12.4%, a difference of 0.10%), and Panamanian (12.4%, a difference of 0.11%).
| Demographics | Rating | Rank | Female Disability |
| Ute | 14.7 /100 | #212 | Poor 12.4% |
| Immigrants | Thailand | 14.5 /100 | #213 | Poor 12.4% |
| Panamanians | 13.5 /100 | #214 | Poor 12.4% |
| Samoans | 13.4 /100 | #215 | Poor 12.4% |
| Immigrants | Burma/Myanmar | 13.3 /100 | #216 | Poor 12.4% |
| British | 12.7 /100 | #217 | Poor 12.4% |
| Immigrants | Bahamas | 12.5 /100 | #218 | Poor 12.4% |
| Europeans | 12.1 /100 | #219 | Poor 12.4% |
| Bahamians | 11.1 /100 | #220 | Poor 12.4% |
| Native Hawaiians | 10.8 /100 | #221 | Poor 12.4% |
| Italians | 10.7 /100 | #222 | Poor 12.4% |
| Guamanians/Chamorros | 9.5 /100 | #223 | Tragic 12.5% |
| Belizeans | 9.3 /100 | #224 | Tragic 12.5% |
| Poles | 8.4 /100 | #225 | Tragic 12.5% |
| Hispanics or Latinos | 8.0 /100 | #226 | Tragic 12.5% |
Demographics Similar to Immigrants from Ireland by Female Disability
In terms of female disability, the demographic groups most similar to Immigrants from Ireland are Immigrants from Chile (11.5%, a difference of 0.040%), Colombian (11.5%, a difference of 0.050%), Chilean (11.5%, a difference of 0.070%), Immigrants from Switzerland (11.5%, a difference of 0.080%), and Immigrants from Northern Africa (11.5%, a difference of 0.13%).
| Demographics | Rating | Rank | Female Disability |
| Immigrants | El Salvador | 99.9 /100 | #64 | Exceptional 11.4% |
| Immigrants | South America | 99.9 /100 | #65 | Exceptional 11.4% |
| Salvadorans | 99.8 /100 | #66 | Exceptional 11.5% |
| Immigrants | Vietnam | 99.8 /100 | #67 | Exceptional 11.5% |
| Immigrants | Northern Africa | 99.8 /100 | #68 | Exceptional 11.5% |
| Colombians | 99.8 /100 | #69 | Exceptional 11.5% |
| Immigrants | Chile | 99.8 /100 | #70 | Exceptional 11.5% |
| Immigrants | Ireland | 99.8 /100 | #71 | Exceptional 11.5% |
| Chileans | 99.8 /100 | #72 | Exceptional 11.5% |
| Immigrants | Switzerland | 99.8 /100 | #73 | Exceptional 11.5% |
| Bhutanese | 99.8 /100 | #74 | Exceptional 11.5% |
| Immigrants | Lebanon | 99.7 /100 | #75 | Exceptional 11.5% |
| Immigrants | Eritrea | 99.7 /100 | #76 | Exceptional 11.5% |
| Immigrants | Afghanistan | 99.7 /100 | #77 | Exceptional 11.5% |
| Immigrants | South Africa | 99.7 /100 | #78 | Exceptional 11.5% |