European vs Immigrants from Nigeria Female Disability
COMPARE
European
Immigrants from Nigeria
Female Disability
Female Disability Comparison
Europeans
Immigrants from Nigeria
12.4%
FEMALE DISABILITY
12.1/ 100
METRIC RATING
219th/ 347
METRIC RANK
11.8%
FEMALE DISABILITY
97.2/ 100
METRIC RATING
118th/ 347
METRIC RANK
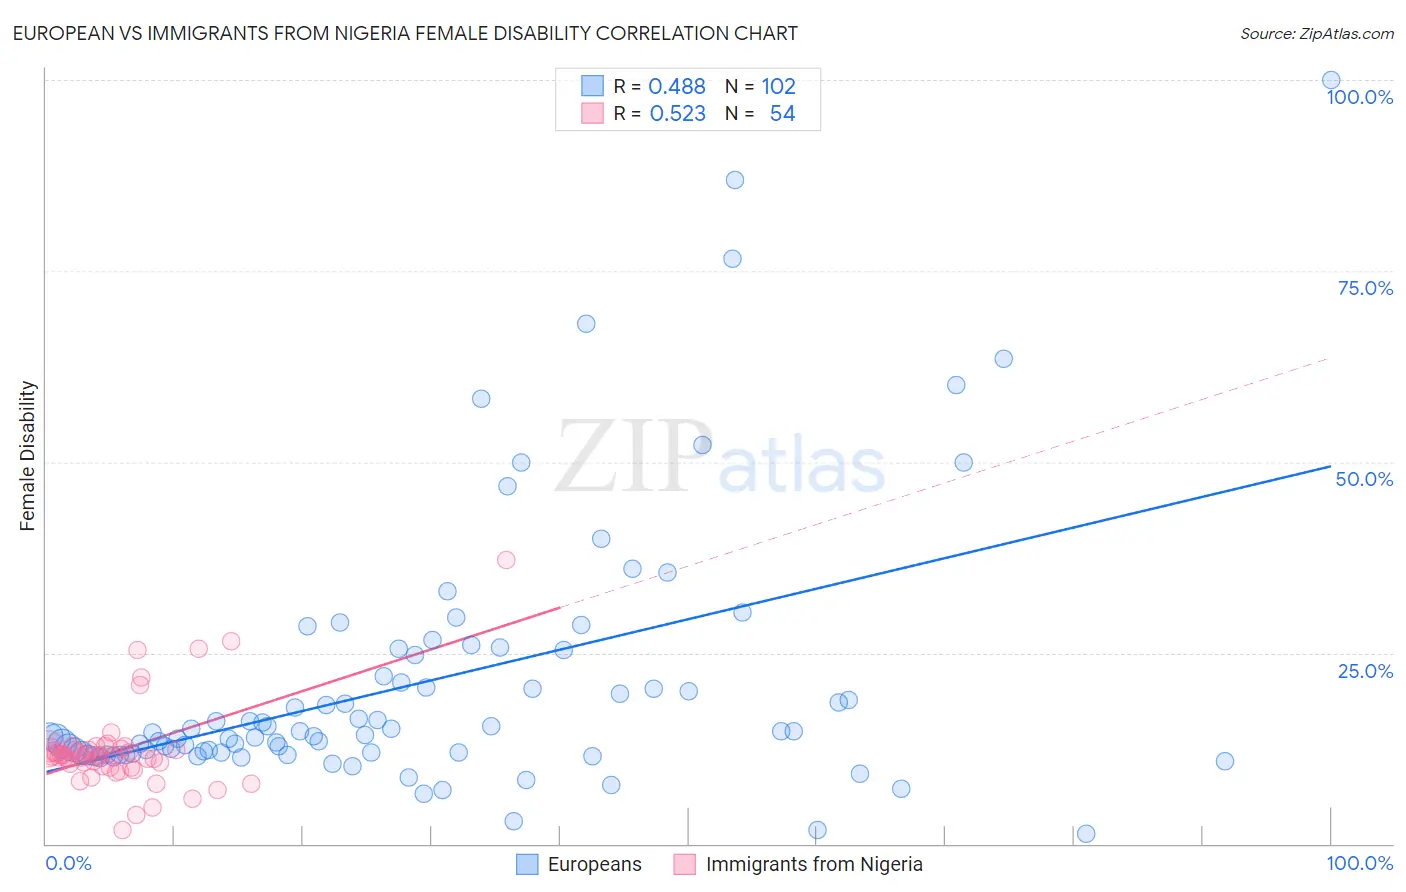
European vs Immigrants from Nigeria Female Disability Correlation Chart
The statistical analysis conducted on geographies consisting of 561,578,477 people shows a moderate positive correlation between the proportion of Europeans and percentage of females with a disability in the United States with a correlation coefficient (R) of 0.488 and weighted average of 12.4%. Similarly, the statistical analysis conducted on geographies consisting of 283,471,855 people shows a substantial positive correlation between the proportion of Immigrants from Nigeria and percentage of females with a disability in the United States with a correlation coefficient (R) of 0.523 and weighted average of 11.8%, a difference of 5.4%.
Female Disability Correlation Summary
| Measurement | European | Immigrants from Nigeria |
| Minimum | 1.3% | 1.7% |
| Maximum | 100.0% | 37.1% |
| Range | 98.8% | 35.4% |
| Mean | 21.2% | 12.3% |
| Median | 14.4% | 11.5% |
| Interquartile 25% (IQ1) | 11.9% | 10.1% |
| Interquartile 75% (IQ3) | 24.8% | 12.4% |
| Interquartile Range (IQR) | 12.9% | 2.3% |
| Standard Deviation (Sample) | 17.6% | 5.8% |
| Standard Deviation (Population) | 17.5% | 5.7% |
Similar Demographics by Female Disability
Demographics Similar to Europeans by Female Disability
In terms of female disability, the demographic groups most similar to Europeans are Immigrants from Bahamas (12.4%, a difference of 0.030%), British (12.4%, a difference of 0.050%), Bahamian (12.4%, a difference of 0.090%), Immigrants from Burma/Myanmar (12.4%, a difference of 0.10%), and Panamanian (12.4%, a difference of 0.11%).
| Demographics | Rating | Rank | Female Disability |
| Ute | 14.7 /100 | #212 | Poor 12.4% |
| Immigrants | Thailand | 14.5 /100 | #213 | Poor 12.4% |
| Panamanians | 13.5 /100 | #214 | Poor 12.4% |
| Samoans | 13.4 /100 | #215 | Poor 12.4% |
| Immigrants | Burma/Myanmar | 13.3 /100 | #216 | Poor 12.4% |
| British | 12.7 /100 | #217 | Poor 12.4% |
| Immigrants | Bahamas | 12.5 /100 | #218 | Poor 12.4% |
| Europeans | 12.1 /100 | #219 | Poor 12.4% |
| Bahamians | 11.1 /100 | #220 | Poor 12.4% |
| Native Hawaiians | 10.8 /100 | #221 | Poor 12.4% |
| Italians | 10.7 /100 | #222 | Poor 12.4% |
| Guamanians/Chamorros | 9.5 /100 | #223 | Tragic 12.5% |
| Belizeans | 9.3 /100 | #224 | Tragic 12.5% |
| Poles | 8.4 /100 | #225 | Tragic 12.5% |
| Hispanics or Latinos | 8.0 /100 | #226 | Tragic 12.5% |
Demographics Similar to Immigrants from Nigeria by Female Disability
In terms of female disability, the demographic groups most similar to Immigrants from Nigeria are Immigrants from Eastern Europe (11.8%, a difference of 0.0%), Immigrants from Uganda (11.8%, a difference of 0.010%), Immigrants from Kazakhstan (11.8%, a difference of 0.090%), Immigrants from Netherlands (11.8%, a difference of 0.11%), and Immigrants from North Macedonia (11.8%, a difference of 0.12%).
| Demographics | Rating | Rank | Female Disability |
| Costa Ricans | 98.1 /100 | #111 | Exceptional 11.7% |
| Immigrants | Bangladesh | 97.8 /100 | #112 | Exceptional 11.8% |
| Immigrants | Belarus | 97.8 /100 | #113 | Exceptional 11.8% |
| South Africans | 97.7 /100 | #114 | Exceptional 11.8% |
| Brazilians | 97.7 /100 | #115 | Exceptional 11.8% |
| Immigrants | Morocco | 97.6 /100 | #116 | Exceptional 11.8% |
| Immigrants | Eastern Europe | 97.2 /100 | #117 | Exceptional 11.8% |
| Immigrants | Nigeria | 97.2 /100 | #118 | Exceptional 11.8% |
| Immigrants | Uganda | 97.2 /100 | #119 | Exceptional 11.8% |
| Immigrants | Kazakhstan | 97.0 /100 | #120 | Exceptional 11.8% |
| Immigrants | Netherlands | 96.9 /100 | #121 | Exceptional 11.8% |
| Immigrants | North Macedonia | 96.8 /100 | #122 | Exceptional 11.8% |
| Immigrants | Croatia | 96.7 /100 | #123 | Exceptional 11.8% |
| Russians | 96.5 /100 | #124 | Exceptional 11.8% |
| Immigrants | Italy | 96.4 /100 | #125 | Exceptional 11.8% |