European vs Syrian Hearing Disability
COMPARE
European
Syrian
Hearing Disability
Hearing Disability Comparison
Europeans
Syrians
3.5%
HEARING DISABILITY
0.1/ 100
METRIC RATING
270th/ 347
METRIC RANK
3.1%
HEARING DISABILITY
19.2/ 100
METRIC RATING
199th/ 347
METRIC RANK
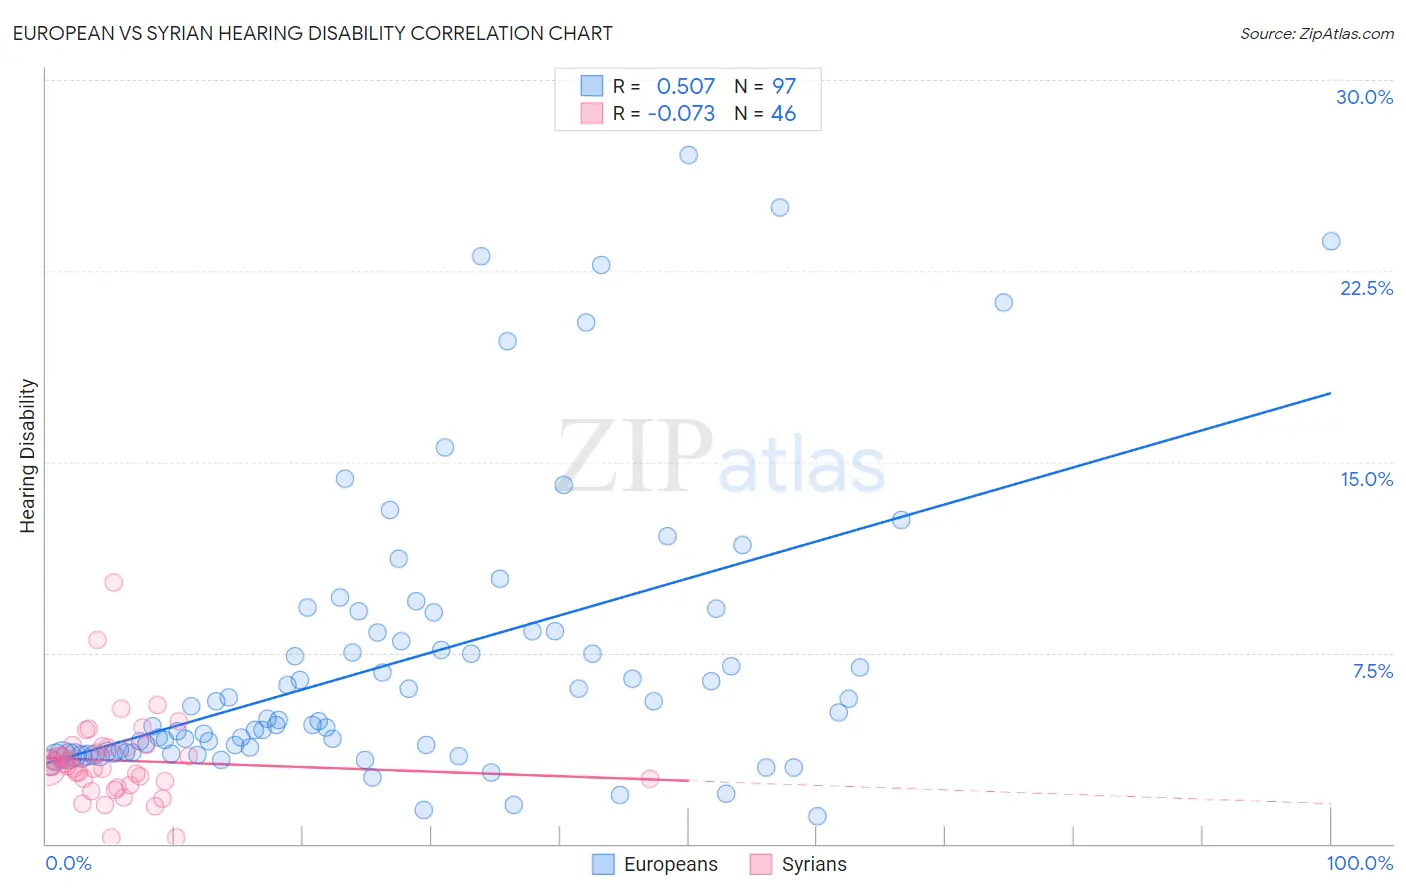
European vs Syrian Hearing Disability Correlation Chart
The statistical analysis conducted on geographies consisting of 561,261,732 people shows a substantial positive correlation between the proportion of Europeans and percentage of population with hearing disability in the United States with a correlation coefficient (R) of 0.507 and weighted average of 3.5%. Similarly, the statistical analysis conducted on geographies consisting of 266,258,902 people shows a slight negative correlation between the proportion of Syrians and percentage of population with hearing disability in the United States with a correlation coefficient (R) of -0.073 and weighted average of 3.1%, a difference of 13.4%.
Hearing Disability Correlation Summary
| Measurement | European | Syrian |
| Minimum | 1.1% | 0.27% |
| Maximum | 27.1% | 10.3% |
| Range | 26.0% | 10.0% |
| Mean | 7.2% | 3.3% |
| Median | 4.8% | 3.0% |
| Interquartile 25% (IQ1) | 3.6% | 2.5% |
| Interquartile 75% (IQ3) | 8.3% | 3.8% |
| Interquartile Range (IQR) | 4.8% | 1.3% |
| Standard Deviation (Sample) | 5.6% | 1.7% |
| Standard Deviation (Population) | 5.6% | 1.7% |
Similar Demographics by Hearing Disability
Demographics Similar to Europeans by Hearing Disability
In terms of hearing disability, the demographic groups most similar to Europeans are Czech (3.5%, a difference of 0.26%), Ute (3.5%, a difference of 0.35%), Fijian (3.5%, a difference of 0.52%), Puerto Rican (3.5%, a difference of 0.59%), and Spaniard (3.5%, a difference of 0.65%).
| Demographics | Rating | Rank | Hearing Disability |
| Immigrants | Canada | 0.1 /100 | #263 | Tragic 3.5% |
| Immigrants | Germany | 0.1 /100 | #264 | Tragic 3.5% |
| British | 0.1 /100 | #265 | Tragic 3.5% |
| Belgians | 0.1 /100 | #266 | Tragic 3.5% |
| Canadians | 0.1 /100 | #267 | Tragic 3.5% |
| Spaniards | 0.1 /100 | #268 | Tragic 3.5% |
| Ute | 0.1 /100 | #269 | Tragic 3.5% |
| Europeans | 0.1 /100 | #270 | Tragic 3.5% |
| Czechs | 0.1 /100 | #271 | Tragic 3.5% |
| Fijians | 0.0 /100 | #272 | Tragic 3.5% |
| Puerto Ricans | 0.0 /100 | #273 | Tragic 3.5% |
| Swiss | 0.0 /100 | #274 | Tragic 3.5% |
| Czechoslovakians | 0.0 /100 | #275 | Tragic 3.6% |
| Danes | 0.0 /100 | #276 | Tragic 3.6% |
| Immigrants | Nonimmigrants | 0.0 /100 | #277 | Tragic 3.6% |
Demographics Similar to Syrians by Hearing Disability
In terms of hearing disability, the demographic groups most similar to Syrians are Immigrants from North Macedonia (3.1%, a difference of 0.010%), Iraqi (3.1%, a difference of 0.030%), Immigrants from Croatia (3.1%, a difference of 0.18%), Immigrants from Bosnia and Herzegovina (3.1%, a difference of 0.20%), and Immigrants from Thailand (3.1%, a difference of 0.43%).
| Demographics | Rating | Rank | Hearing Disability |
| Koreans | 27.6 /100 | #192 | Fair 3.1% |
| Macedonians | 27.0 /100 | #193 | Fair 3.1% |
| South Africans | 24.5 /100 | #194 | Fair 3.1% |
| Spanish American Indians | 24.1 /100 | #195 | Fair 3.1% |
| Immigrants | Europe | 22.9 /100 | #196 | Fair 3.1% |
| Immigrants | Bosnia and Herzegovina | 20.6 /100 | #197 | Fair 3.1% |
| Immigrants | Croatia | 20.5 /100 | #198 | Fair 3.1% |
| Syrians | 19.2 /100 | #199 | Poor 3.1% |
| Immigrants | North Macedonia | 19.1 /100 | #200 | Poor 3.1% |
| Iraqis | 19.0 /100 | #201 | Poor 3.1% |
| Immigrants | Thailand | 16.4 /100 | #202 | Poor 3.1% |
| Immigrants | Denmark | 16.2 /100 | #203 | Poor 3.1% |
| Immigrants | Czechoslovakia | 15.9 /100 | #204 | Poor 3.1% |
| Alsatians | 15.9 /100 | #205 | Poor 3.1% |
| Eastern Europeans | 15.5 /100 | #206 | Poor 3.1% |