Ethiopian vs Immigrants from Chile Vision Disability
COMPARE
Ethiopian
Immigrants from Chile
Vision Disability
Vision Disability Comparison
Ethiopians
Immigrants from Chile
2.0%
VISION DISABILITY
99.7/ 100
METRIC RATING
45th/ 347
METRIC RANK
2.1%
VISION DISABILITY
89.0/ 100
METRIC RATING
128th/ 347
METRIC RANK
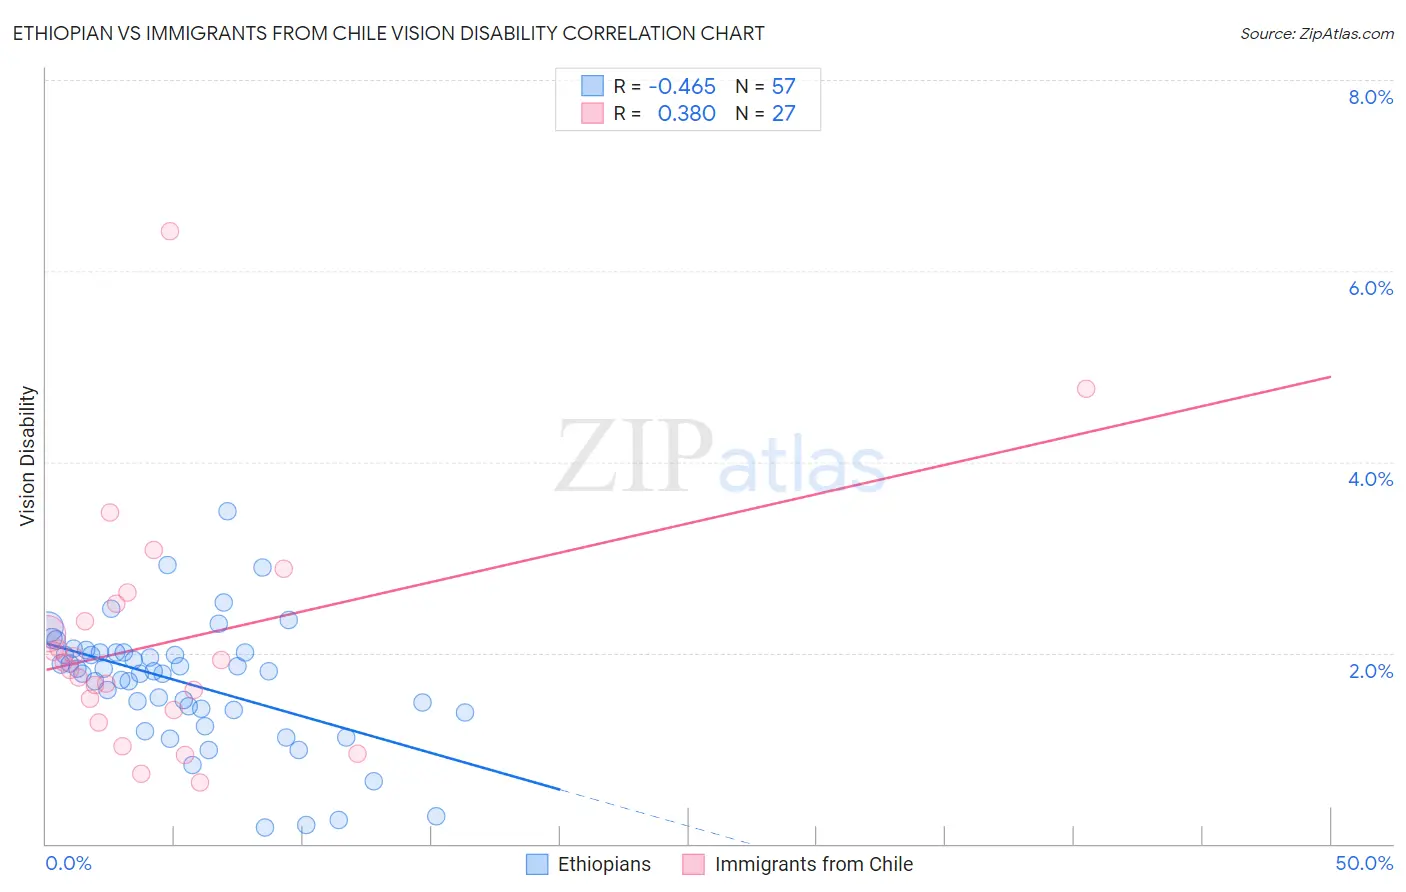
Ethiopian vs Immigrants from Chile Vision Disability Correlation Chart
The statistical analysis conducted on geographies consisting of 223,170,588 people shows a moderate negative correlation between the proportion of Ethiopians and percentage of population with vision disability in the United States with a correlation coefficient (R) of -0.465 and weighted average of 2.0%. Similarly, the statistical analysis conducted on geographies consisting of 218,580,502 people shows a mild positive correlation between the proportion of Immigrants from Chile and percentage of population with vision disability in the United States with a correlation coefficient (R) of 0.380 and weighted average of 2.1%, a difference of 6.2%.
Vision Disability Correlation Summary
| Measurement | Ethiopian | Immigrants from Chile |
| Minimum | 0.17% | 0.64% |
| Maximum | 3.5% | 6.4% |
| Range | 3.3% | 5.8% |
| Mean | 1.7% | 2.1% |
| Median | 1.8% | 1.9% |
| Interquartile 25% (IQ1) | 1.4% | 1.4% |
| Interquartile 75% (IQ3) | 2.0% | 2.5% |
| Interquartile Range (IQR) | 0.62% | 1.1% |
| Standard Deviation (Sample) | 0.65% | 1.2% |
| Standard Deviation (Population) | 0.64% | 1.2% |
Similar Demographics by Vision Disability
Demographics Similar to Ethiopians by Vision Disability
In terms of vision disability, the demographic groups most similar to Ethiopians are Immigrants from Indonesia (2.0%, a difference of 0.030%), Immigrants from Sweden (2.0%, a difference of 0.040%), Eastern European (2.0%, a difference of 0.050%), Immigrants from Bulgaria (2.0%, a difference of 0.060%), and Immigrants from Ethiopia (2.0%, a difference of 0.11%).
| Demographics | Rating | Rank | Vision Disability |
| Immigrants | Kuwait | 99.8 /100 | #38 | Exceptional 2.0% |
| Zimbabweans | 99.7 /100 | #39 | Exceptional 2.0% |
| Immigrants | Ireland | 99.7 /100 | #40 | Exceptional 2.0% |
| Cypriots | 99.7 /100 | #41 | Exceptional 2.0% |
| Immigrants | Ethiopia | 99.7 /100 | #42 | Exceptional 2.0% |
| Eastern Europeans | 99.7 /100 | #43 | Exceptional 2.0% |
| Immigrants | Indonesia | 99.7 /100 | #44 | Exceptional 2.0% |
| Ethiopians | 99.7 /100 | #45 | Exceptional 2.0% |
| Immigrants | Sweden | 99.7 /100 | #46 | Exceptional 2.0% |
| Immigrants | Bulgaria | 99.7 /100 | #47 | Exceptional 2.0% |
| Israelis | 99.6 /100 | #48 | Exceptional 2.0% |
| Latvians | 99.5 /100 | #49 | Exceptional 2.0% |
| Afghans | 99.5 /100 | #50 | Exceptional 2.0% |
| Tongans | 99.5 /100 | #51 | Exceptional 2.0% |
| Immigrants | Serbia | 99.4 /100 | #52 | Exceptional 2.0% |
Demographics Similar to Immigrants from Chile by Vision Disability
In terms of vision disability, the demographic groups most similar to Immigrants from Chile are Sudanese (2.1%, a difference of 0.030%), Immigrants from Cameroon (2.1%, a difference of 0.030%), Immigrants from Kenya (2.1%, a difference of 0.040%), Immigrants from Hungary (2.1%, a difference of 0.050%), and Immigrants from Peru (2.1%, a difference of 0.10%).
| Demographics | Rating | Rank | Vision Disability |
| Immigrants | Scotland | 90.4 /100 | #121 | Exceptional 2.1% |
| Immigrants | Ukraine | 90.4 /100 | #122 | Exceptional 2.1% |
| Immigrants | Albania | 90.4 /100 | #123 | Exceptional 2.1% |
| Immigrants | Spain | 89.8 /100 | #124 | Excellent 2.1% |
| Immigrants | Venezuela | 89.8 /100 | #125 | Excellent 2.1% |
| Immigrants | Peru | 89.5 /100 | #126 | Excellent 2.1% |
| Sudanese | 89.2 /100 | #127 | Excellent 2.1% |
| Immigrants | Chile | 89.0 /100 | #128 | Excellent 2.1% |
| Immigrants | Cameroon | 88.8 /100 | #129 | Excellent 2.1% |
| Immigrants | Kenya | 88.7 /100 | #130 | Excellent 2.1% |
| Immigrants | Hungary | 88.7 /100 | #131 | Excellent 2.1% |
| New Zealanders | 88.2 /100 | #132 | Excellent 2.1% |
| Syrians | 87.5 /100 | #133 | Excellent 2.1% |
| Venezuelans | 87.2 /100 | #134 | Excellent 2.1% |
| Vietnamese | 86.7 /100 | #135 | Excellent 2.1% |