Spanish vs Immigrants from Chile Vision Disability
COMPARE
Spanish
Immigrants from Chile
Vision Disability
Vision Disability Comparison
Spanish
Immigrants from Chile
2.4%
VISION DISABILITY
0.0/ 100
METRIC RATING
278th/ 347
METRIC RANK
2.1%
VISION DISABILITY
89.0/ 100
METRIC RATING
128th/ 347
METRIC RANK
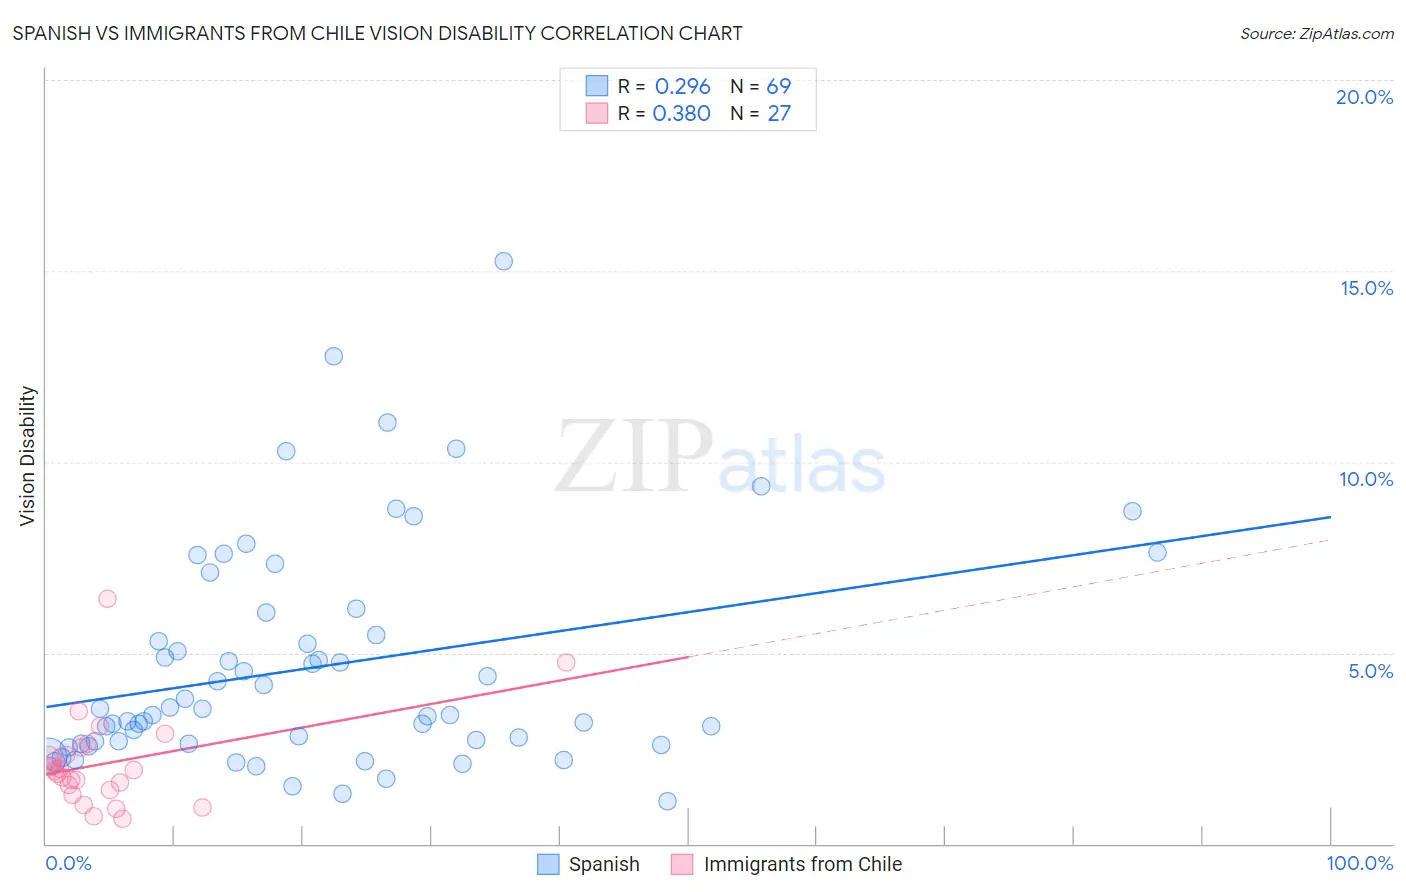
Spanish vs Immigrants from Chile Vision Disability Correlation Chart
The statistical analysis conducted on geographies consisting of 421,761,942 people shows a weak positive correlation between the proportion of Spanish and percentage of population with vision disability in the United States with a correlation coefficient (R) of 0.296 and weighted average of 2.4%. Similarly, the statistical analysis conducted on geographies consisting of 218,580,502 people shows a mild positive correlation between the proportion of Immigrants from Chile and percentage of population with vision disability in the United States with a correlation coefficient (R) of 0.380 and weighted average of 2.1%, a difference of 16.7%.
Vision Disability Correlation Summary
| Measurement | Spanish | Immigrants from Chile |
| Minimum | 1.1% | 0.64% |
| Maximum | 15.3% | 6.4% |
| Range | 14.1% | 5.8% |
| Mean | 4.6% | 2.1% |
| Median | 3.4% | 1.9% |
| Interquartile 25% (IQ1) | 2.6% | 1.4% |
| Interquartile 75% (IQ3) | 5.8% | 2.5% |
| Interquartile Range (IQR) | 3.1% | 1.1% |
| Standard Deviation (Sample) | 2.9% | 1.2% |
| Standard Deviation (Population) | 2.9% | 1.2% |
Similar Demographics by Vision Disability
Demographics Similar to Spanish by Vision Disability
In terms of vision disability, the demographic groups most similar to Spanish are Nepalese (2.4%, a difference of 0.010%), Cape Verdean (2.4%, a difference of 0.050%), Bahamian (2.4%, a difference of 0.16%), Scotch-Irish (2.4%, a difference of 0.20%), and U.S. Virgin Islander (2.5%, a difference of 0.28%).
| Demographics | Rating | Rank | Vision Disability |
| Immigrants | Azores | 0.1 /100 | #271 | Tragic 2.4% |
| Spaniards | 0.1 /100 | #272 | Tragic 2.4% |
| Immigrants | Bahamas | 0.1 /100 | #273 | Tragic 2.4% |
| Immigrants | Latin America | 0.0 /100 | #274 | Tragic 2.4% |
| Chippewa | 0.0 /100 | #275 | Tragic 2.4% |
| Scotch-Irish | 0.0 /100 | #276 | Tragic 2.4% |
| Bahamians | 0.0 /100 | #277 | Tragic 2.4% |
| Spanish | 0.0 /100 | #278 | Tragic 2.4% |
| Nepalese | 0.0 /100 | #279 | Tragic 2.4% |
| Cape Verdeans | 0.0 /100 | #280 | Tragic 2.4% |
| U.S. Virgin Islanders | 0.0 /100 | #281 | Tragic 2.5% |
| Immigrants | Caribbean | 0.0 /100 | #282 | Tragic 2.5% |
| Puget Sound Salish | 0.0 /100 | #283 | Tragic 2.5% |
| Yakama | 0.0 /100 | #284 | Tragic 2.5% |
| Immigrants | Central America | 0.0 /100 | #285 | Tragic 2.5% |
Demographics Similar to Immigrants from Chile by Vision Disability
In terms of vision disability, the demographic groups most similar to Immigrants from Chile are Sudanese (2.1%, a difference of 0.030%), Immigrants from Cameroon (2.1%, a difference of 0.030%), Immigrants from Kenya (2.1%, a difference of 0.040%), Immigrants from Hungary (2.1%, a difference of 0.050%), and Immigrants from Peru (2.1%, a difference of 0.10%).
| Demographics | Rating | Rank | Vision Disability |
| Immigrants | Scotland | 90.4 /100 | #121 | Exceptional 2.1% |
| Immigrants | Ukraine | 90.4 /100 | #122 | Exceptional 2.1% |
| Immigrants | Albania | 90.4 /100 | #123 | Exceptional 2.1% |
| Immigrants | Spain | 89.8 /100 | #124 | Excellent 2.1% |
| Immigrants | Venezuela | 89.8 /100 | #125 | Excellent 2.1% |
| Immigrants | Peru | 89.5 /100 | #126 | Excellent 2.1% |
| Sudanese | 89.2 /100 | #127 | Excellent 2.1% |
| Immigrants | Chile | 89.0 /100 | #128 | Excellent 2.1% |
| Immigrants | Cameroon | 88.8 /100 | #129 | Excellent 2.1% |
| Immigrants | Kenya | 88.7 /100 | #130 | Excellent 2.1% |
| Immigrants | Hungary | 88.7 /100 | #131 | Excellent 2.1% |
| New Zealanders | 88.2 /100 | #132 | Excellent 2.1% |
| Syrians | 87.5 /100 | #133 | Excellent 2.1% |
| Venezuelans | 87.2 /100 | #134 | Excellent 2.1% |
| Vietnamese | 86.7 /100 | #135 | Excellent 2.1% |