Shoshone vs Immigrants from Chile Vision Disability
COMPARE
Shoshone
Immigrants from Chile
Vision Disability
Vision Disability Comparison
Shoshone
Immigrants from Chile
2.7%
VISION DISABILITY
0.0/ 100
METRIC RATING
316th/ 347
METRIC RANK
2.1%
VISION DISABILITY
89.0/ 100
METRIC RATING
128th/ 347
METRIC RANK
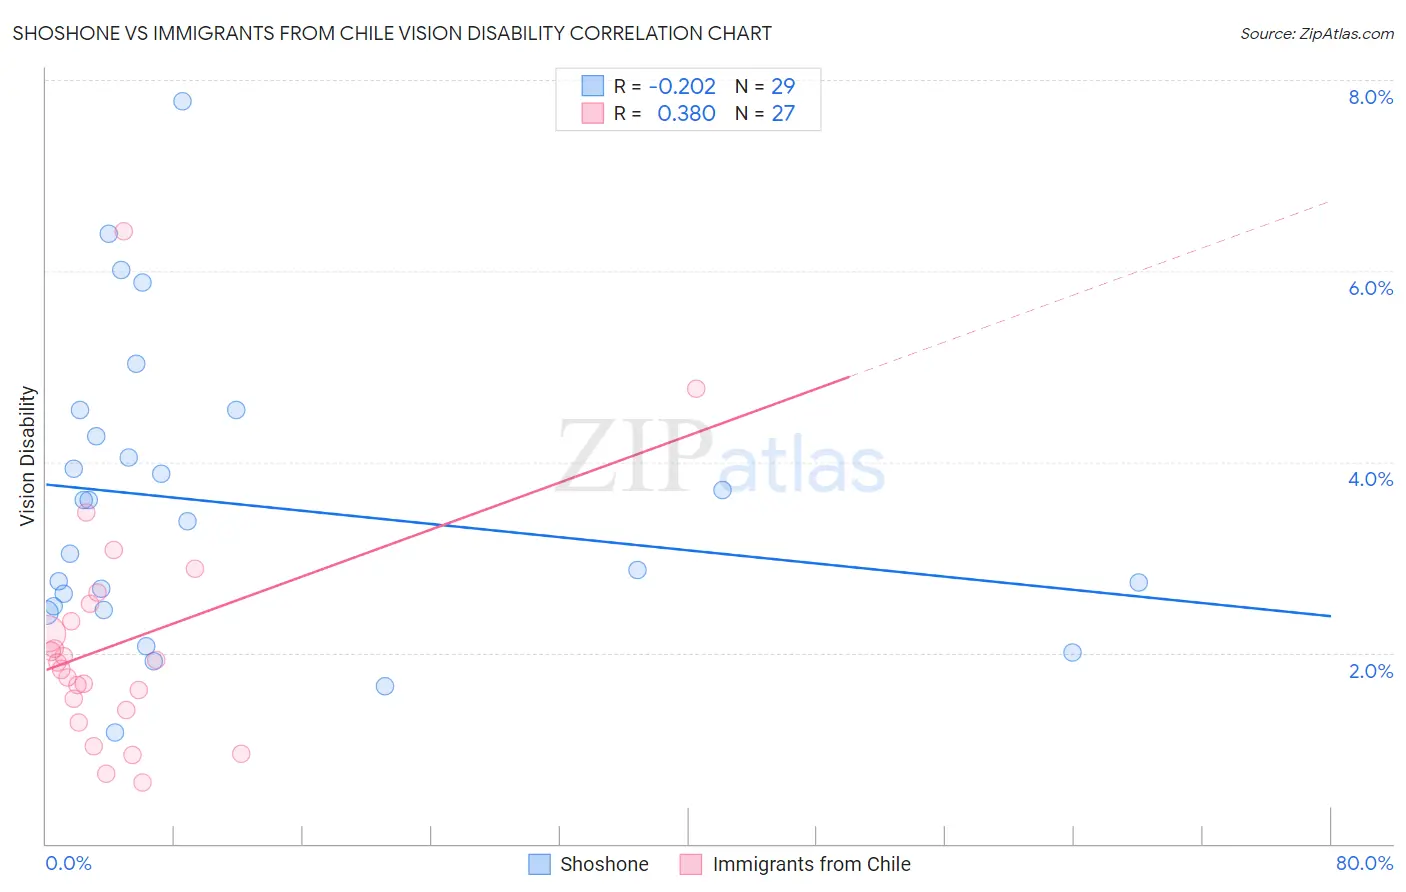
Shoshone vs Immigrants from Chile Vision Disability Correlation Chart
The statistical analysis conducted on geographies consisting of 66,614,475 people shows a weak negative correlation between the proportion of Shoshone and percentage of population with vision disability in the United States with a correlation coefficient (R) of -0.202 and weighted average of 2.7%. Similarly, the statistical analysis conducted on geographies consisting of 218,580,502 people shows a mild positive correlation between the proportion of Immigrants from Chile and percentage of population with vision disability in the United States with a correlation coefficient (R) of 0.380 and weighted average of 2.1%, a difference of 28.6%.
Vision Disability Correlation Summary
| Measurement | Shoshone | Immigrants from Chile |
| Minimum | 1.2% | 0.64% |
| Maximum | 7.8% | 6.4% |
| Range | 6.6% | 5.8% |
| Mean | 3.6% | 2.1% |
| Median | 3.4% | 1.9% |
| Interquartile 25% (IQ1) | 2.5% | 1.4% |
| Interquartile 75% (IQ3) | 4.4% | 2.5% |
| Interquartile Range (IQR) | 1.9% | 1.1% |
| Standard Deviation (Sample) | 1.5% | 1.2% |
| Standard Deviation (Population) | 1.5% | 1.2% |
Similar Demographics by Vision Disability
Demographics Similar to Shoshone by Vision Disability
In terms of vision disability, the demographic groups most similar to Shoshone are Yup'ik (2.7%, a difference of 0.20%), Osage (2.7%, a difference of 0.43%), Alaska Native (2.7%, a difference of 1.3%), Inupiat (2.7%, a difference of 1.6%), and Potawatomi (2.6%, a difference of 1.7%).
| Demographics | Rating | Rank | Vision Disability |
| Immigrants | Yemen | 0.0 /100 | #309 | Tragic 2.6% |
| Blackfeet | 0.0 /100 | #310 | Tragic 2.6% |
| Dominicans | 0.0 /100 | #311 | Tragic 2.6% |
| Americans | 0.0 /100 | #312 | Tragic 2.6% |
| Potawatomi | 0.0 /100 | #313 | Tragic 2.6% |
| Inupiat | 0.0 /100 | #314 | Tragic 2.7% |
| Osage | 0.0 /100 | #315 | Tragic 2.7% |
| Shoshone | 0.0 /100 | #316 | Tragic 2.7% |
| Yup'ik | 0.0 /100 | #317 | Tragic 2.7% |
| Alaska Natives | 0.0 /100 | #318 | Tragic 2.7% |
| Tohono O'odham | 0.0 /100 | #319 | Tragic 2.8% |
| Blacks/African Americans | 0.0 /100 | #320 | Tragic 2.8% |
| Comanche | 0.0 /100 | #321 | Tragic 2.8% |
| Paiute | 0.0 /100 | #322 | Tragic 2.9% |
| Tlingit-Haida | 0.0 /100 | #323 | Tragic 2.9% |
Demographics Similar to Immigrants from Chile by Vision Disability
In terms of vision disability, the demographic groups most similar to Immigrants from Chile are Sudanese (2.1%, a difference of 0.030%), Immigrants from Cameroon (2.1%, a difference of 0.030%), Immigrants from Kenya (2.1%, a difference of 0.040%), Immigrants from Hungary (2.1%, a difference of 0.050%), and Immigrants from Peru (2.1%, a difference of 0.10%).
| Demographics | Rating | Rank | Vision Disability |
| Immigrants | Scotland | 90.4 /100 | #121 | Exceptional 2.1% |
| Immigrants | Ukraine | 90.4 /100 | #122 | Exceptional 2.1% |
| Immigrants | Albania | 90.4 /100 | #123 | Exceptional 2.1% |
| Immigrants | Spain | 89.8 /100 | #124 | Excellent 2.1% |
| Immigrants | Venezuela | 89.8 /100 | #125 | Excellent 2.1% |
| Immigrants | Peru | 89.5 /100 | #126 | Excellent 2.1% |
| Sudanese | 89.2 /100 | #127 | Excellent 2.1% |
| Immigrants | Chile | 89.0 /100 | #128 | Excellent 2.1% |
| Immigrants | Cameroon | 88.8 /100 | #129 | Excellent 2.1% |
| Immigrants | Kenya | 88.7 /100 | #130 | Excellent 2.1% |
| Immigrants | Hungary | 88.7 /100 | #131 | Excellent 2.1% |
| New Zealanders | 88.2 /100 | #132 | Excellent 2.1% |
| Syrians | 87.5 /100 | #133 | Excellent 2.1% |
| Venezuelans | 87.2 /100 | #134 | Excellent 2.1% |
| Vietnamese | 86.7 /100 | #135 | Excellent 2.1% |