Ethiopian vs Palestinian Vision Disability
COMPARE
Ethiopian
Palestinian
Vision Disability
Vision Disability Comparison
Ethiopians
Palestinians
2.0%
VISION DISABILITY
99.7/ 100
METRIC RATING
45th/ 347
METRIC RANK
2.0%
VISION DISABILITY
98.3/ 100
METRIC RATING
74th/ 347
METRIC RANK
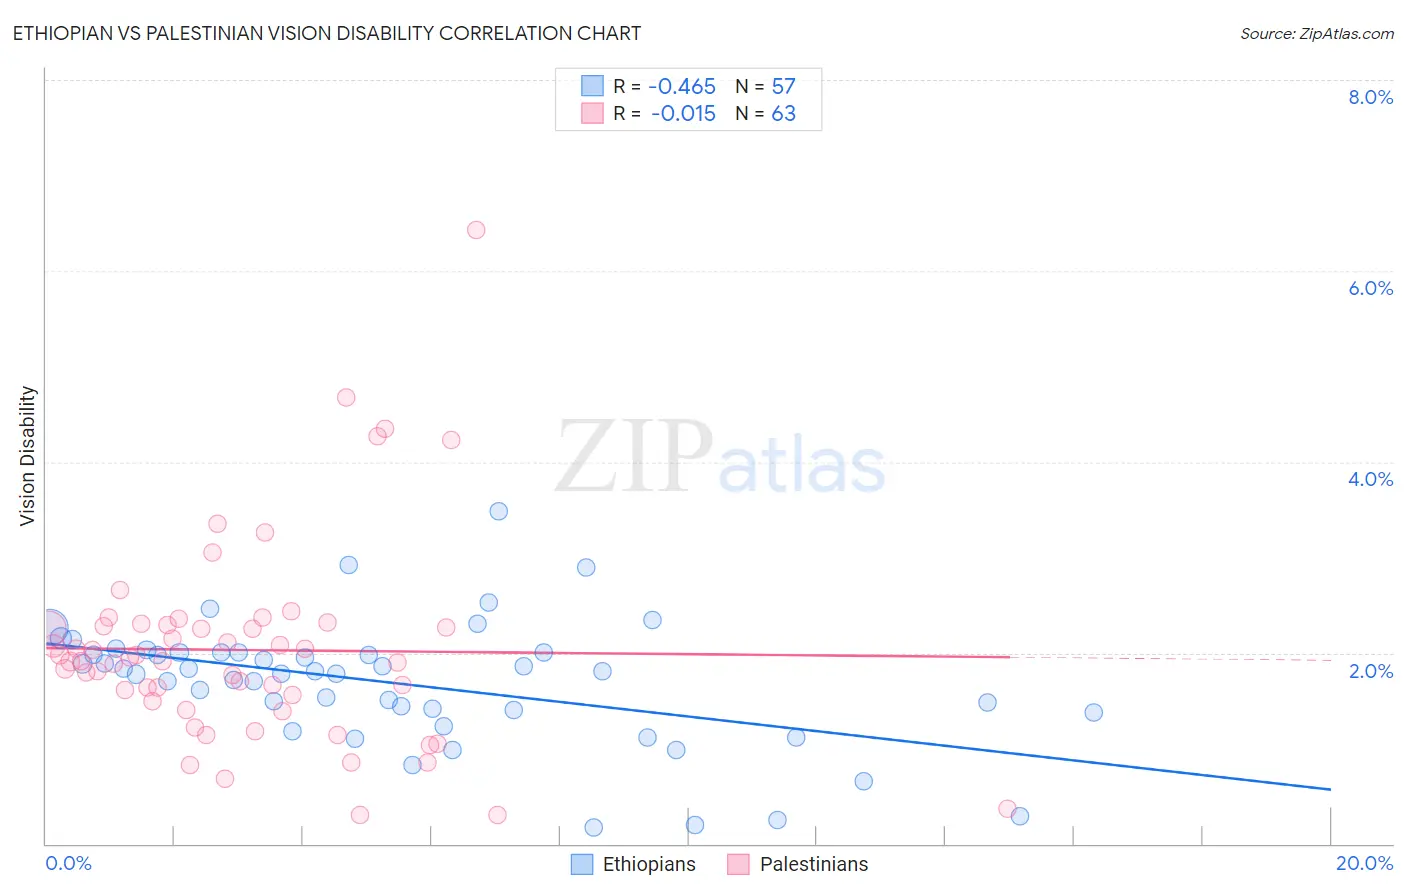
Ethiopian vs Palestinian Vision Disability Correlation Chart
The statistical analysis conducted on geographies consisting of 223,170,588 people shows a moderate negative correlation between the proportion of Ethiopians and percentage of population with vision disability in the United States with a correlation coefficient (R) of -0.465 and weighted average of 2.0%. Similarly, the statistical analysis conducted on geographies consisting of 216,427,848 people shows no correlation between the proportion of Palestinians and percentage of population with vision disability in the United States with a correlation coefficient (R) of -0.015 and weighted average of 2.0%, a difference of 2.8%.
Vision Disability Correlation Summary
| Measurement | Ethiopian | Palestinian |
| Minimum | 0.17% | 0.30% |
| Maximum | 3.5% | 6.4% |
| Range | 3.3% | 6.1% |
| Mean | 1.7% | 2.0% |
| Median | 1.8% | 1.9% |
| Interquartile 25% (IQ1) | 1.4% | 1.5% |
| Interquartile 75% (IQ3) | 2.0% | 2.3% |
| Interquartile Range (IQR) | 0.62% | 0.81% |
| Standard Deviation (Sample) | 0.65% | 1.1% |
| Standard Deviation (Population) | 0.64% | 1.1% |
Similar Demographics by Vision Disability
Demographics Similar to Ethiopians by Vision Disability
In terms of vision disability, the demographic groups most similar to Ethiopians are Immigrants from Indonesia (2.0%, a difference of 0.030%), Immigrants from Sweden (2.0%, a difference of 0.040%), Eastern European (2.0%, a difference of 0.050%), Immigrants from Bulgaria (2.0%, a difference of 0.060%), and Immigrants from Ethiopia (2.0%, a difference of 0.11%).
| Demographics | Rating | Rank | Vision Disability |
| Immigrants | Kuwait | 99.8 /100 | #38 | Exceptional 2.0% |
| Zimbabweans | 99.7 /100 | #39 | Exceptional 2.0% |
| Immigrants | Ireland | 99.7 /100 | #40 | Exceptional 2.0% |
| Cypriots | 99.7 /100 | #41 | Exceptional 2.0% |
| Immigrants | Ethiopia | 99.7 /100 | #42 | Exceptional 2.0% |
| Eastern Europeans | 99.7 /100 | #43 | Exceptional 2.0% |
| Immigrants | Indonesia | 99.7 /100 | #44 | Exceptional 2.0% |
| Ethiopians | 99.7 /100 | #45 | Exceptional 2.0% |
| Immigrants | Sweden | 99.7 /100 | #46 | Exceptional 2.0% |
| Immigrants | Bulgaria | 99.7 /100 | #47 | Exceptional 2.0% |
| Israelis | 99.6 /100 | #48 | Exceptional 2.0% |
| Latvians | 99.5 /100 | #49 | Exceptional 2.0% |
| Afghans | 99.5 /100 | #50 | Exceptional 2.0% |
| Tongans | 99.5 /100 | #51 | Exceptional 2.0% |
| Immigrants | Serbia | 99.4 /100 | #52 | Exceptional 2.0% |
Demographics Similar to Palestinians by Vision Disability
In terms of vision disability, the demographic groups most similar to Palestinians are Immigrants from North Macedonia (2.0%, a difference of 0.0%), Paraguayan (2.0%, a difference of 0.020%), Immigrants from Jordan (2.0%, a difference of 0.020%), Immigrants from Eritrea (2.0%, a difference of 0.050%), and Immigrants from Eastern Europe (2.0%, a difference of 0.050%).
| Demographics | Rating | Rank | Vision Disability |
| Immigrants | Northern Africa | 98.8 /100 | #67 | Exceptional 2.0% |
| Immigrants | Czechoslovakia | 98.7 /100 | #68 | Exceptional 2.0% |
| Russians | 98.6 /100 | #69 | Exceptional 2.0% |
| Immigrants | Kazakhstan | 98.6 /100 | #70 | Exceptional 2.0% |
| Immigrants | Northern Europe | 98.6 /100 | #71 | Exceptional 2.0% |
| Immigrants | France | 98.5 /100 | #72 | Exceptional 2.0% |
| Immigrants | Eritrea | 98.4 /100 | #73 | Exceptional 2.0% |
| Palestinians | 98.3 /100 | #74 | Exceptional 2.0% |
| Immigrants | North Macedonia | 98.3 /100 | #75 | Exceptional 2.0% |
| Paraguayans | 98.3 /100 | #76 | Exceptional 2.0% |
| Immigrants | Jordan | 98.3 /100 | #77 | Exceptional 2.0% |
| Immigrants | Eastern Europe | 98.3 /100 | #78 | Exceptional 2.0% |
| Assyrians/Chaldeans/Syriacs | 98.1 /100 | #79 | Exceptional 2.0% |
| Lithuanians | 97.7 /100 | #80 | Exceptional 2.0% |
| Soviet Union | 97.6 /100 | #81 | Exceptional 2.0% |