Taiwanese vs Immigrants from Chile Vision Disability

COMPARE

Taiwanese
Race
Ancestry
AfghanAfricanAlaska NativeAlaskan AthabascanAlbanianAleutAlsatianAmericanApacheArabArapahoArgentineanArmenianAssyrian/Chaldean/SyriacAustralianAustrianBahamianBangladeshiBarbadianBasqueBelgianBelizeanBermudanBhutaneseBlackfeetBolivianBrazilianBritishBritish West IndianBulgarianBurmeseCajunCambodianCanadianCape VerdeanCarpatho RusynCelticCentral AmericanCentral American IndianCherokeeCheyenneChickasawChileanChineseChippewaChoctawColombianColvilleComancheCosta RicanCreeCreekCroatianCrowCubanCypriotCzechCzechoslovakianDanishDelawareDominicanDutchDutch West IndianEastern EuropeanEcuadorianEgyptianEnglishEstonianEthiopianEuropeanFijianFilipinoFinnishFrenchFrench American IndianFrench CanadianGermanGerman RussianGhanaianGreekGuamanian/ChamorroGuatemalanGuyaneseHaitianHmongHonduranHopiHoumaHungarianIcelanderIndian (Asian)IndonesianInupiatIranianIraqiIrishIroquoisIsraeliItalianJamaicanJapaneseJordanianKenyanKiowaKoreanLaotianLatvianLebaneseLiberianLithuanianLumbeeLuxembourgerMacedonianMalaysianMalteseMarshalleseMenomineeMexicanMexican American IndianMongolianMoroccanNative HawaiianNavajoNepaleseNew ZealanderNicaraguanNigerianNorthern EuropeanNorwegianOkinawanOsageOttawaPaiutePakistaniPalestinianPanamanianParaguayanPennsylvania GermanPeruvianPimaPolishPortuguesePotawatomiPuebloPuerto RicanPuget Sound SalishRomanianRussianSalvadoranSamoanScandinavianScotch-IrishScottishSeminoleSenegaleseSerbianShoshoneSierra LeoneanSiouxSlavicSlovakSloveneSomaliSouth AfricanSouth AmericanSouth American IndianSoviet UnionSpaniardSpanishSpanish AmericanSpanish American IndianSri LankanSubsaharan AfricanSudaneseSwedishSwissSyrianTaiwaneseThaiTlingit-HaidaTohono O'OdhamTonganTrinidadian and TobagonianTsimshianTurkishU.S. Virgin IslanderUgandanUkrainianUruguayanUteVenezuelanVietnameseWelshWest IndianYakamaYaquiYugoslavianYumanYup'ikZimbabwean
Immigration
NonimmigrantsImmigrantsAfghanistanAfricaAlbaniaArgentinaArmeniaAsiaAustraliaAustriaBahamasBangladeshBarbadosBelarusBelgiumBelizeBoliviaBosnia and HerzegovinaBrazilBulgariaBurma/MyanmarCabo VerdeCambodiaCameroonCanadaCaribbeanCentral AmericaChinaColombiaCongoCosta RicaCroatiaCubaCzechoslovakiaDenmarkDominicaDominican RepublicEastern AfricaEastern AsiaEastern EuropeEcuadorEgyptEl SalvadorEnglandEritreaEthiopiaEuropeFijiFranceGermanyGhanaGreeceGrenadaGuatemalaGuyanaHaitiHondurasHong KongHungaryIndiaIndonesiaIranIraqIrelandIsraelItalyJamaicaJapanJordanKazakhstanKenyaKoreaKuwaitLaosLatin AmericaLatviaLebanonLiberiaLithuaniaMalaysiaMexicoMicronesiaMiddle AfricaMoldovaMoroccoNepalNetherlandsNicaraguaNigeriaNorth AmericaNorth MacedoniaNorthern AfricaNorthern EuropeNorwayOceaniaPakistanPanamaPeruPhilippinesPolandPortugalRomaniaRussiaSaudi ArabiaScotlandSenegalSerbiaSierra LeoneSingaporeSomaliaSouth AfricaSouth AmericaSouth Central AsiaSouth Eastern AsiaSouthern EuropeSpainSri LankaSt. Vincent and the GrenadinesSudanSwedenSwitzerlandSyriaTaiwanThailandTrinidad and TobagoTurkeyUgandaUkraineUruguayUzbekistanVenezuelaVietnamWest IndiesWestern AfricaWestern AsiaWestern EuropeYemenZaireZimbabweAzores
Immigrants from Chile
Race
Ancestry
AfghanAfricanAlaska NativeAlaskan AthabascanAlbanianAleutAlsatianAmericanApacheArabArapahoArgentineanArmenianAssyrian/Chaldean/SyriacAustralianAustrianBahamianBangladeshiBarbadianBasqueBelgianBelizeanBermudanBhutaneseBlackfeetBolivianBrazilianBritishBritish West IndianBulgarianBurmeseCajunCambodianCanadianCape VerdeanCarpatho RusynCelticCentral AmericanCentral American IndianCherokeeCheyenneChickasawChileanChineseChippewaChoctawColombianColvilleComancheCosta RicanCreeCreekCroatianCrowCubanCypriotCzechCzechoslovakianDanishDelawareDominicanDutchDutch West IndianEastern EuropeanEcuadorianEgyptianEnglishEstonianEthiopianEuropeanFijianFilipinoFinnishFrenchFrench American IndianFrench CanadianGermanGerman RussianGhanaianGreekGuamanian/ChamorroGuatemalanGuyaneseHaitianHmongHonduranHopiHoumaHungarianIcelanderIndian (Asian)IndonesianInupiatIranianIraqiIrishIroquoisIsraeliItalianJamaicanJapaneseJordanianKenyanKiowaKoreanLaotianLatvianLebaneseLiberianLithuanianLumbeeLuxembourgerMacedonianMalaysianMalteseMarshalleseMenomineeMexicanMexican American IndianMongolianMoroccanNative HawaiianNavajoNepaleseNew ZealanderNicaraguanNigerianNorthern EuropeanNorwegianOkinawanOsageOttawaPaiutePakistaniPalestinianPanamanianParaguayanPennsylvania GermanPeruvianPimaPolishPortuguesePotawatomiPuebloPuerto RicanPuget Sound SalishRomanianRussianSalvadoranSamoanScandinavianScotch-IrishScottishSeminoleSenegaleseSerbianShoshoneSierra LeoneanSiouxSlavicSlovakSloveneSomaliSouth AfricanSouth AmericanSouth American IndianSoviet UnionSpaniardSpanishSpanish AmericanSpanish American IndianSri LankanSubsaharan AfricanSudaneseSwedishSwissSyrianThaiTlingit-HaidaTohono O'OdhamTonganTrinidadian and TobagonianTsimshianTurkishU.S. Virgin IslanderUgandanUkrainianUruguayanUteVenezuelanVietnameseWelshWest IndianYakamaYaquiYugoslavianYumanYup'ikZimbabwean
Immigration
NonimmigrantsImmigrantsAfghanistanAfricaAlbaniaArgentinaArmeniaAsiaAustraliaAustriaBahamasBangladeshBarbadosBelarusBelgiumBelizeBoliviaBosnia and HerzegovinaBrazilBulgariaBurma/MyanmarCabo VerdeCambodiaCameroonCanadaCaribbeanCentral AmericaChileChinaColombiaCongoCosta RicaCroatiaCubaCzechoslovakiaDenmarkDominicaDominican RepublicEastern AfricaEastern AsiaEastern EuropeEcuadorEgyptEl SalvadorEnglandEritreaEthiopiaEuropeFijiFranceGermanyGhanaGreeceGrenadaGuatemalaGuyanaHaitiHondurasHong KongHungaryIndiaIndonesiaIranIraqIrelandIsraelItalyJamaicaJapanJordanKazakhstanKenyaKoreaKuwaitLaosLatin AmericaLatviaLebanonLiberiaLithuaniaMalaysiaMexicoMicronesiaMiddle AfricaMoldovaMoroccoNepalNetherlandsNicaraguaNigeriaNorth AmericaNorth MacedoniaNorthern AfricaNorthern EuropeNorwayOceaniaPakistanPanamaPeruPhilippinesPolandPortugalRomaniaRussiaSaudi ArabiaScotlandSenegalSerbiaSierra LeoneSingaporeSomaliaSouth AfricaSouth AmericaSouth Central AsiaSouth Eastern AsiaSouthern EuropeSpainSri LankaSt. Vincent and the GrenadinesSudanSwedenSwitzerlandSyriaTaiwanThailandTrinidad and TobagoTurkeyUgandaUkraineUruguayUzbekistanVenezuelaVietnamWest IndiesWestern AfricaWestern AsiaWestern EuropeYemenZaireZimbabweAzores
Vision Disability
Income
Poverty
Unemployment
Labor Participation
Family Structure
Vehicle Availability
Education Level
Disability

Vision Disability Comparison

Taiwanese

Immigrants from Chile

Exceptional
Excellent
1.9%
VISION DISABILITY
99.9/ 100
METRIC RATING
27th/ 347
METRIC RANK
2.1%
VISION DISABILITY
89.0/ 100
METRIC RATING
128th/ 347
METRIC RANK

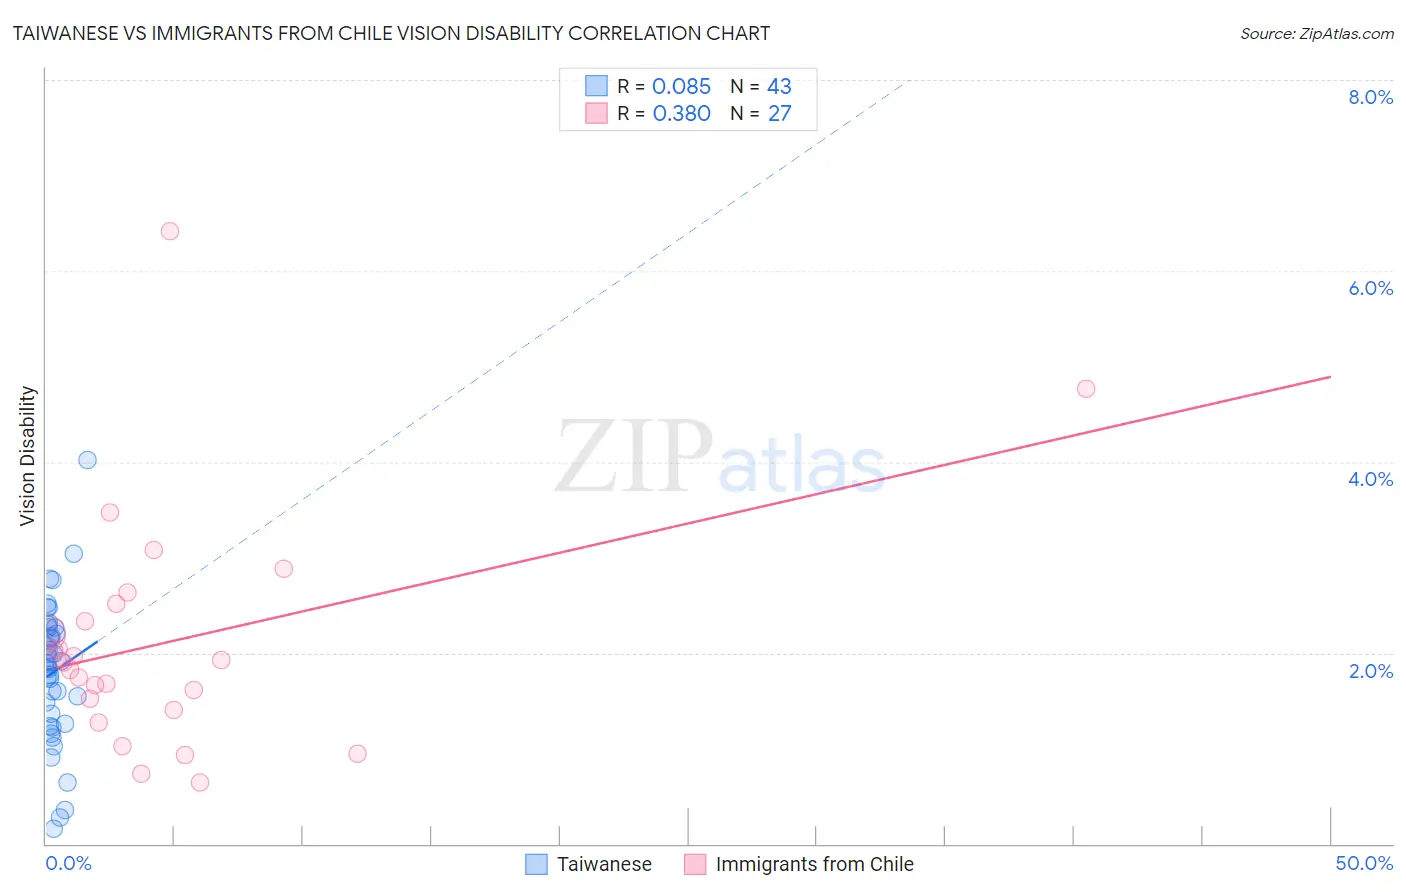
Taiwanese vs Immigrants from Chile Vision Disability Correlation Chart

The statistical analysis conducted on geographies consisting of 31,721,885 people shows a slight positive correlation between the proportion of Taiwanese and percentage of population with vision disability in the United States with a correlation coefficient (R) of 0.085 and weighted average of 1.9%. Similarly, the statistical analysis conducted on geographies consisting of 218,580,502 people shows a mild positive correlation between the proportion of Immigrants from Chile and percentage of population with vision disability in the United States with a correlation coefficient (R) of 0.380 and weighted average of 2.1%, a difference of 8.7%.
Taiwanese vs Immigrants from Chile Vision Disability

Vision Disability Correlation Summary

MeasurementTaiwaneseImmigrants from Chile
Minimum0.15%0.64%
Maximum4.0%6.4%
Range3.9%5.8%
Mean1.8%2.1%
Median1.9%1.9%
Interquartile 25% (IQ1)1.3%1.4%
Interquartile 75% (IQ3)2.3%2.5%
Interquartile Range (IQR)1.0%1.1%
Standard Deviation (Sample)0.75%1.2%
Standard Deviation (Population)0.74%1.2%

Similar Demographics by Vision Disability

Demographics Similar to Taiwanese by Vision Disability

In terms of vision disability, the demographic groups most similar to Taiwanese are Immigrants from Malaysia (1.9%, a difference of 0.020%), Egyptian (1.9%, a difference of 0.090%), Immigrants from Nepal (1.9%, a difference of 0.13%), Mongolian (1.9%, a difference of 0.29%), and Immigrants from Japan (1.9%, a difference of 0.34%).
DemographicsRating | RankVision Disability
Asians
100.0
/100
|
#20
Exceptional
1.9%
Turks
100.0
/100
|
#21
Exceptional
1.9%
Immigrants | Pakistan
100.0
/100
|
#22
Exceptional
1.9%
Immigrants | Asia
99.9
/100
|
#23
Exceptional
1.9%
Immigrants | Lithuania
99.9
/100
|
#24
Exceptional
1.9%
Bulgarians
99.9
/100
|
#25
Exceptional
1.9%
Immigrants | Japan
99.9
/100
|
#26
Exceptional
1.9%
Taiwanese
99.9
/100
|
#27
Exceptional
1.9%
Immigrants | Malaysia
99.9
/100
|
#28
Exceptional
1.9%
Egyptians
99.9
/100
|
#29
Exceptional
1.9%
Immigrants | Nepal
99.9
/100
|
#30
Exceptional
1.9%
Mongolians
99.9
/100
|
#31
Exceptional
1.9%
Luxembourgers
99.9
/100
|
#32
Exceptional
1.9%
Immigrants | Egypt
99.9
/100
|
#33
Exceptional
1.9%
Immigrants | Turkey
99.8
/100
|
#34
Exceptional
1.9%

Demographics Similar to Immigrants from Chile by Vision Disability

In terms of vision disability, the demographic groups most similar to Immigrants from Chile are Sudanese (2.1%, a difference of 0.030%), Immigrants from Cameroon (2.1%, a difference of 0.030%), Immigrants from Kenya (2.1%, a difference of 0.040%), Immigrants from Hungary (2.1%, a difference of 0.050%), and Immigrants from Peru (2.1%, a difference of 0.10%).
DemographicsRating | RankVision Disability
Immigrants | Scotland
90.4
/100
|
#121
Exceptional
2.1%
Immigrants | Ukraine
90.4
/100
|
#122
Exceptional
2.1%
Immigrants | Albania
90.4
/100
|
#123
Exceptional
2.1%
Immigrants | Spain
89.8
/100
|
#124
Excellent
2.1%
Immigrants | Venezuela
89.8
/100
|
#125
Excellent
2.1%
Immigrants | Peru
89.5
/100
|
#126
Excellent
2.1%
Sudanese
89.2
/100
|
#127
Excellent
2.1%
Immigrants | Chile
89.0
/100
|
#128
Excellent
2.1%
Immigrants | Cameroon
88.8
/100
|
#129
Excellent
2.1%
Immigrants | Kenya
88.7
/100
|
#130
Excellent
2.1%
Immigrants | Hungary
88.7
/100
|
#131
Excellent
2.1%
New Zealanders
88.2
/100
|
#132
Excellent
2.1%
Syrians
87.5
/100
|
#133
Excellent
2.1%
Venezuelans
87.2
/100
|
#134
Excellent
2.1%
Vietnamese
86.7
/100
|
#135
Excellent
2.1%