Ethiopian vs Immigrants from Chile Child Poverty Among Boys Under 16
COMPARE
Ethiopian
Immigrants from Chile
Child Poverty Among Boys Under 16
Child Poverty Among Boys Under 16 Comparison
Ethiopians
Immigrants from Chile
16.5%
CHILD POVERTY AMONG BOYS UNDER 16
47.8/ 100
METRIC RATING
177th/ 347
METRIC RANK
15.9%
CHILD POVERTY AMONG BOYS UNDER 16
74.8/ 100
METRIC RATING
159th/ 347
METRIC RANK
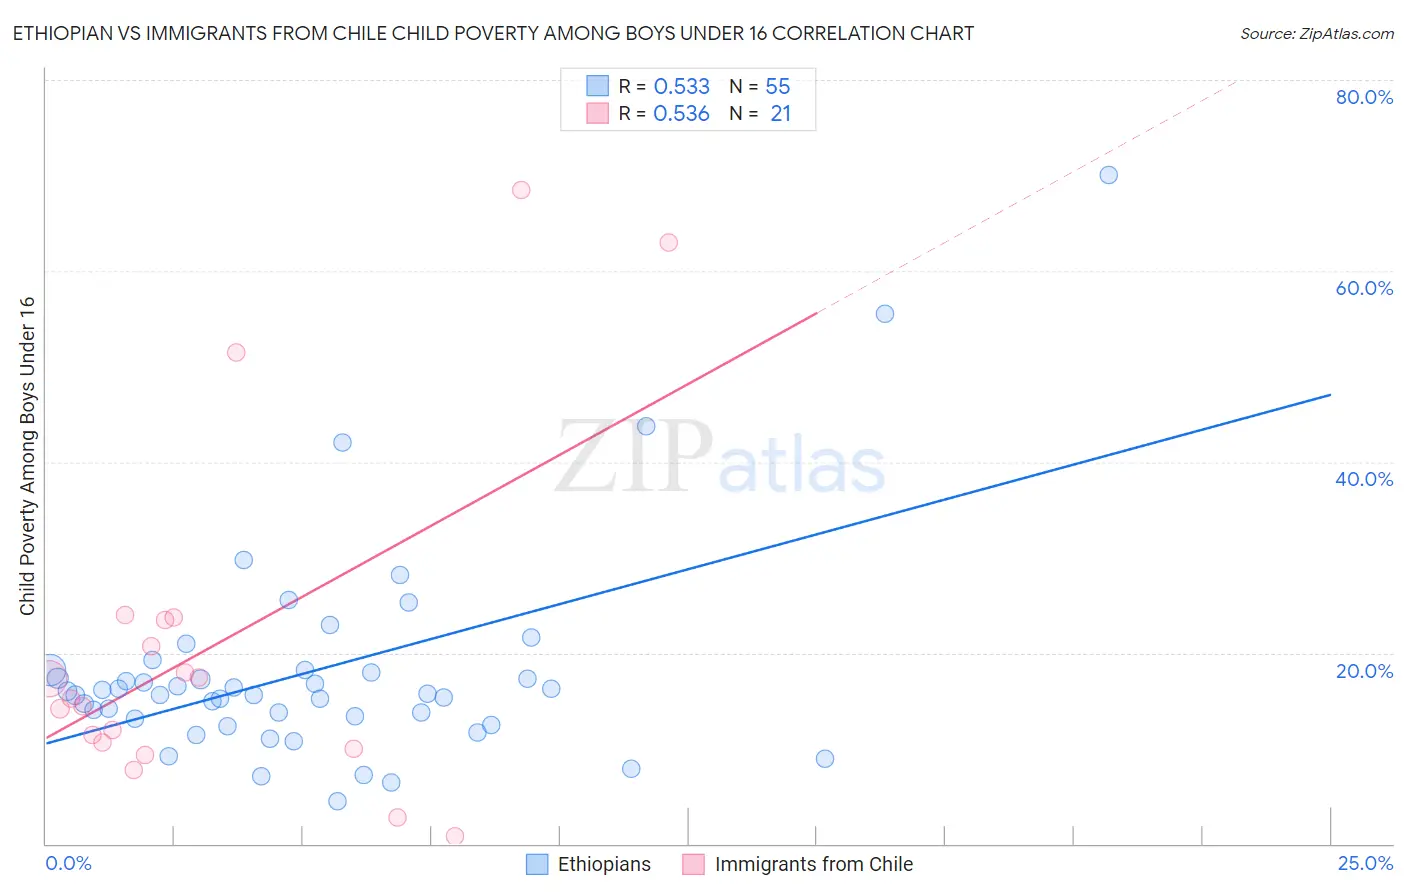
Ethiopian vs Immigrants from Chile Child Poverty Among Boys Under 16 Correlation Chart
The statistical analysis conducted on geographies consisting of 221,584,616 people shows a substantial positive correlation between the proportion of Ethiopians and poverty level among boys under the age of 16 in the United States with a correlation coefficient (R) of 0.533 and weighted average of 16.5%. Similarly, the statistical analysis conducted on geographies consisting of 216,959,929 people shows a substantial positive correlation between the proportion of Immigrants from Chile and poverty level among boys under the age of 16 in the United States with a correlation coefficient (R) of 0.536 and weighted average of 15.9%, a difference of 3.4%.
Child Poverty Among Boys Under 16 Correlation Summary
| Measurement | Ethiopian | Immigrants from Chile |
| Minimum | 4.4% | 0.79% |
| Maximum | 70.0% | 68.4% |
| Range | 65.6% | 67.6% |
| Mean | 18.2% | 20.7% |
| Median | 15.7% | 15.2% |
| Interquartile 25% (IQ1) | 13.2% | 10.3% |
| Interquartile 75% (IQ3) | 18.2% | 23.5% |
| Interquartile Range (IQR) | 5.1% | 13.3% |
| Standard Deviation (Sample) | 11.4% | 18.1% |
| Standard Deviation (Population) | 11.3% | 17.7% |
Demographics Similar to Ethiopians and Immigrants from Chile by Child Poverty Among Boys Under 16
In terms of child poverty among boys under 16, the demographic groups most similar to Ethiopians are White/Caucasian (16.5%, a difference of 0.040%), Scotch-Irish (16.5%, a difference of 0.040%), Immigrants from Syria (16.5%, a difference of 0.14%), Uruguayan (16.4%, a difference of 0.24%), and Tsimshian (16.4%, a difference of 0.30%). Similarly, the demographic groups most similar to Immigrants from Chile are Yugoslavian (15.9%, a difference of 0.17%), Immigrants from Northern Africa (16.0%, a difference of 0.51%), Immigrants from Oceania (16.0%, a difference of 0.52%), Guamanian/Chamorro (16.1%, a difference of 0.75%), and Costa Rican (16.1%, a difference of 0.95%).
| Demographics | Rating | Rank | Child Poverty Among Boys Under 16 |
| Yugoslavians | 75.9 /100 | #158 | Good 15.9% |
| Immigrants | Chile | 74.8 /100 | #159 | Good 15.9% |
| Immigrants | Northern Africa | 71.3 /100 | #160 | Good 16.0% |
| Immigrants | Oceania | 71.3 /100 | #161 | Good 16.0% |
| Guamanians/Chamorros | 69.6 /100 | #162 | Good 16.1% |
| Costa Ricans | 68.1 /100 | #163 | Good 16.1% |
| Immigrants | Albania | 67.9 /100 | #164 | Good 16.1% |
| Colombians | 65.2 /100 | #165 | Good 16.1% |
| Immigrants | Germany | 63.6 /100 | #166 | Good 16.2% |
| Afghans | 55.4 /100 | #167 | Average 16.3% |
| South Americans | 55.3 /100 | #168 | Average 16.3% |
| Immigrants | Saudi Arabia | 53.6 /100 | #169 | Average 16.4% |
| Immigrants | Bosnia and Herzegovina | 51.7 /100 | #170 | Average 16.4% |
| Immigrants | Ethiopia | 51.3 /100 | #171 | Average 16.4% |
| Immigrants | Colombia | 50.8 /100 | #172 | Average 16.4% |
| Tsimshian | 50.5 /100 | #173 | Average 16.4% |
| Uruguayans | 50.0 /100 | #174 | Average 16.4% |
| Immigrants | Syria | 49.0 /100 | #175 | Average 16.5% |
| Whites/Caucasians | 48.2 /100 | #176 | Average 16.5% |
| Ethiopians | 47.8 /100 | #177 | Average 16.5% |
| Scotch-Irish | 47.5 /100 | #178 | Average 16.5% |