Ethiopian vs Immigrants from Jamaica Ambulatory Disability
COMPARE
Ethiopian
Immigrants from Jamaica
Ambulatory Disability
Ambulatory Disability Comparison
Ethiopians
Immigrants from Jamaica
5.4%
AMBULATORY DISABILITY
100.0/ 100
METRIC RATING
20th/ 347
METRIC RANK
6.8%
AMBULATORY DISABILITY
0.0/ 100
METRIC RATING
284th/ 347
METRIC RANK
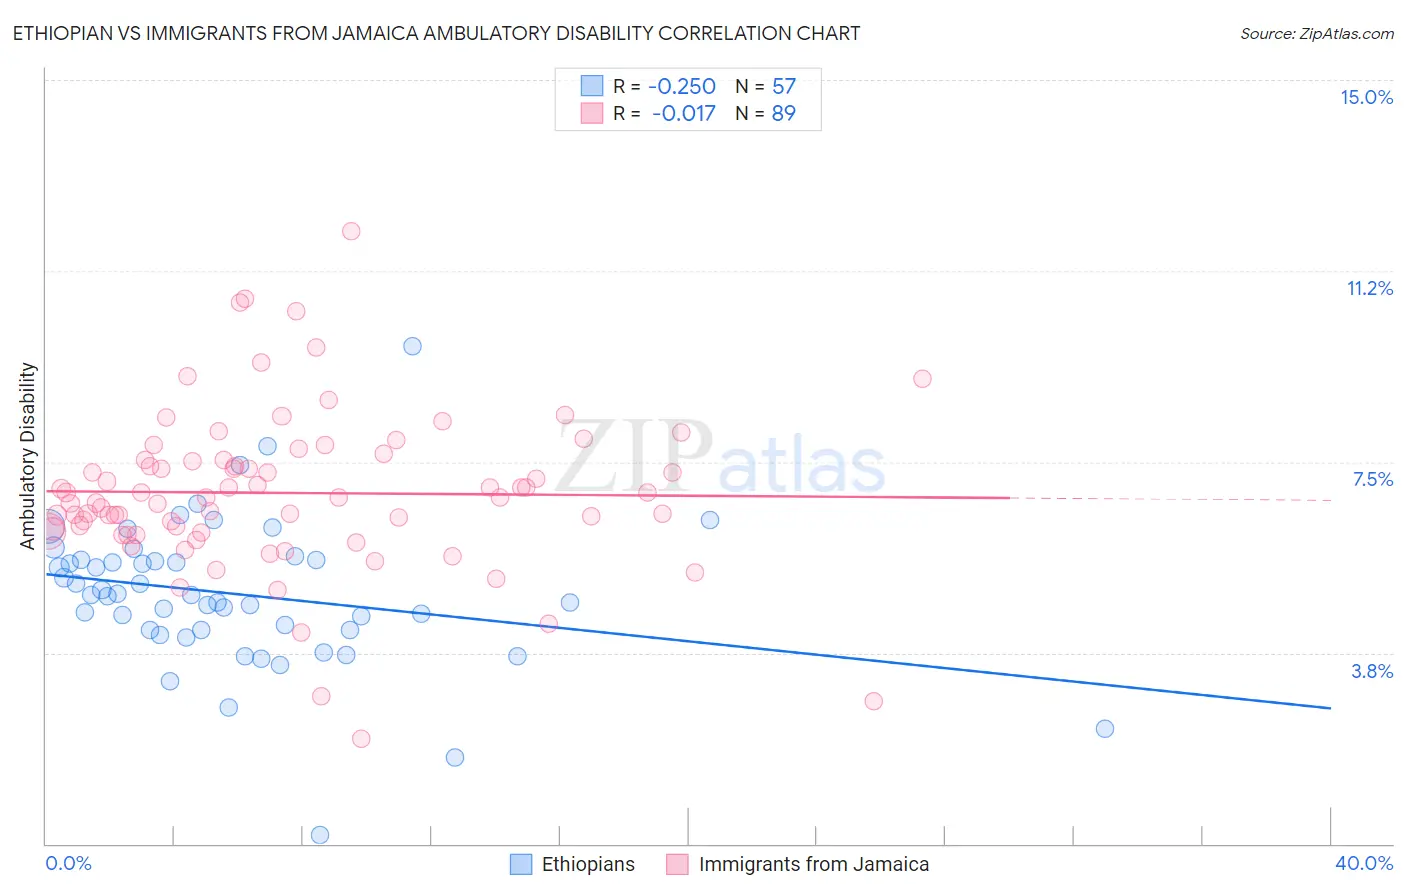
Ethiopian vs Immigrants from Jamaica Ambulatory Disability Correlation Chart
The statistical analysis conducted on geographies consisting of 223,167,947 people shows a weak negative correlation between the proportion of Ethiopians and percentage of population with ambulatory disability in the United States with a correlation coefficient (R) of -0.250 and weighted average of 5.4%. Similarly, the statistical analysis conducted on geographies consisting of 301,698,027 people shows no correlation between the proportion of Immigrants from Jamaica and percentage of population with ambulatory disability in the United States with a correlation coefficient (R) of -0.017 and weighted average of 6.8%, a difference of 26.4%.
Ambulatory Disability Correlation Summary
| Measurement | Ethiopian | Immigrants from Jamaica |
| Minimum | 0.17% | 2.1% |
| Maximum | 9.8% | 12.0% |
| Range | 9.6% | 10.0% |
| Mean | 4.9% | 6.9% |
| Median | 4.9% | 6.8% |
| Interquartile 25% (IQ1) | 4.2% | 6.1% |
| Interquartile 75% (IQ3) | 5.6% | 7.5% |
| Interquartile Range (IQR) | 1.4% | 1.4% |
| Standard Deviation (Sample) | 1.5% | 1.6% |
| Standard Deviation (Population) | 1.5% | 1.6% |
Similar Demographics by Ambulatory Disability
Demographics Similar to Ethiopians by Ambulatory Disability
In terms of ambulatory disability, the demographic groups most similar to Ethiopians are Immigrants from Kuwait (5.4%, a difference of 0.0%), Indian (Asian) (5.4%, a difference of 0.020%), Immigrants from Sri Lanka (5.4%, a difference of 0.12%), Immigrants from Ethiopia (5.4%, a difference of 0.13%), and Immigrants from Israel (5.4%, a difference of 0.37%).
| Demographics | Rating | Rank | Ambulatory Disability |
| Burmese | 100.0 /100 | #13 | Exceptional 5.3% |
| Immigrants | Eastern Asia | 100.0 /100 | #14 | Exceptional 5.3% |
| Immigrants | China | 100.0 /100 | #15 | Exceptional 5.3% |
| Immigrants | Hong Kong | 100.0 /100 | #16 | Exceptional 5.3% |
| Immigrants | Ethiopia | 100.0 /100 | #17 | Exceptional 5.4% |
| Immigrants | Sri Lanka | 100.0 /100 | #18 | Exceptional 5.4% |
| Indians (Asian) | 100.0 /100 | #19 | Exceptional 5.4% |
| Ethiopians | 100.0 /100 | #20 | Exceptional 5.4% |
| Immigrants | Kuwait | 100.0 /100 | #21 | Exceptional 5.4% |
| Immigrants | Israel | 100.0 /100 | #22 | Exceptional 5.4% |
| Tongans | 100.0 /100 | #23 | Exceptional 5.4% |
| Immigrants | Saudi Arabia | 100.0 /100 | #24 | Exceptional 5.4% |
| Zimbabweans | 100.0 /100 | #25 | Exceptional 5.4% |
| Immigrants | Nepal | 100.0 /100 | #26 | Exceptional 5.4% |
| Asians | 100.0 /100 | #27 | Exceptional 5.4% |
Demographics Similar to Immigrants from Jamaica by Ambulatory Disability
In terms of ambulatory disability, the demographic groups most similar to Immigrants from Jamaica are Immigrants from Barbados (6.8%, a difference of 0.070%), Barbadian (6.8%, a difference of 0.23%), Yaqui (6.8%, a difference of 0.35%), Fijian (6.8%, a difference of 0.41%), and Pennsylvania German (6.8%, a difference of 0.42%).
| Demographics | Rating | Rank | Ambulatory Disability |
| Jamaicans | 0.1 /100 | #277 | Tragic 6.7% |
| Immigrants | West Indies | 0.1 /100 | #278 | Tragic 6.7% |
| Immigrants | Caribbean | 0.0 /100 | #279 | Tragic 6.7% |
| Pennsylvania Germans | 0.0 /100 | #280 | Tragic 6.8% |
| Yaqui | 0.0 /100 | #281 | Tragic 6.8% |
| Barbadians | 0.0 /100 | #282 | Tragic 6.8% |
| Immigrants | Barbados | 0.0 /100 | #283 | Tragic 6.8% |
| Immigrants | Jamaica | 0.0 /100 | #284 | Tragic 6.8% |
| Fijians | 0.0 /100 | #285 | Tragic 6.8% |
| Yakama | 0.0 /100 | #286 | Tragic 6.8% |
| U.S. Virgin Islanders | 0.0 /100 | #287 | Tragic 6.8% |
| Immigrants | Nonimmigrants | 0.0 /100 | #288 | Tragic 6.9% |
| Immigrants | Dominica | 0.0 /100 | #289 | Tragic 6.9% |
| Scotch-Irish | 0.0 /100 | #290 | Tragic 6.9% |
| West Indians | 0.0 /100 | #291 | Tragic 6.9% |