Ethiopian vs Immigrants from Kenya Ambulatory Disability
COMPARE
Ethiopian
Immigrants from Kenya
Ambulatory Disability
Ambulatory Disability Comparison
Ethiopians
Immigrants from Kenya
5.4%
AMBULATORY DISABILITY
100.0/ 100
METRIC RATING
20th/ 347
METRIC RANK
5.8%
AMBULATORY DISABILITY
97.8/ 100
METRIC RATING
102nd/ 347
METRIC RANK
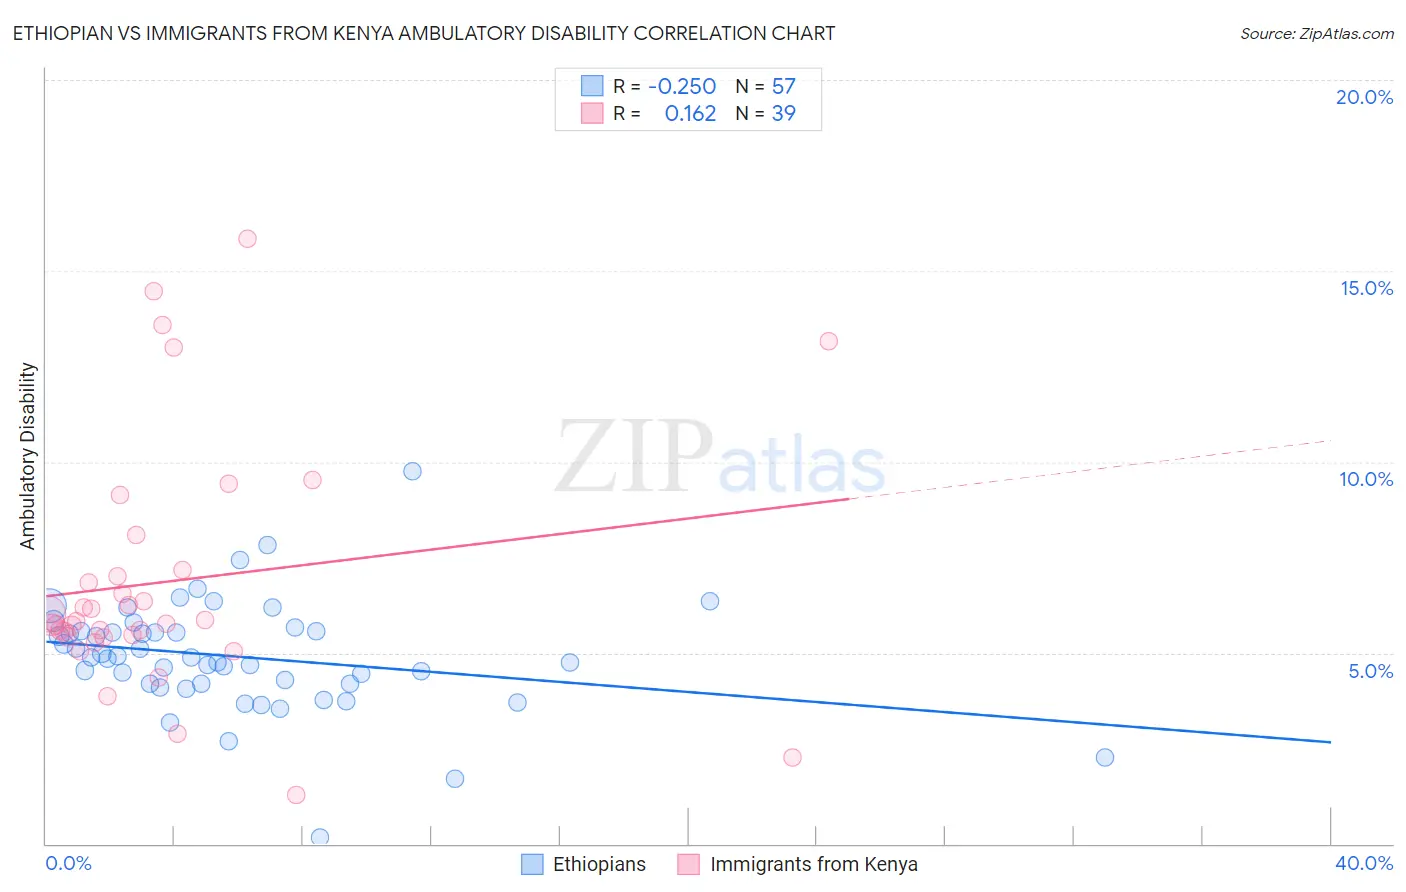
Ethiopian vs Immigrants from Kenya Ambulatory Disability Correlation Chart
The statistical analysis conducted on geographies consisting of 223,167,947 people shows a weak negative correlation between the proportion of Ethiopians and percentage of population with ambulatory disability in the United States with a correlation coefficient (R) of -0.250 and weighted average of 5.4%. Similarly, the statistical analysis conducted on geographies consisting of 218,037,313 people shows a poor positive correlation between the proportion of Immigrants from Kenya and percentage of population with ambulatory disability in the United States with a correlation coefficient (R) of 0.162 and weighted average of 5.8%, a difference of 8.3%.
Ambulatory Disability Correlation Summary
| Measurement | Ethiopian | Immigrants from Kenya |
| Minimum | 0.17% | 1.3% |
| Maximum | 9.8% | 15.8% |
| Range | 9.6% | 14.6% |
| Mean | 4.9% | 6.9% |
| Median | 4.9% | 5.8% |
| Interquartile 25% (IQ1) | 4.2% | 5.4% |
| Interquartile 75% (IQ3) | 5.6% | 7.2% |
| Interquartile Range (IQR) | 1.4% | 1.7% |
| Standard Deviation (Sample) | 1.5% | 3.2% |
| Standard Deviation (Population) | 1.5% | 3.2% |
Similar Demographics by Ambulatory Disability
Demographics Similar to Ethiopians by Ambulatory Disability
In terms of ambulatory disability, the demographic groups most similar to Ethiopians are Immigrants from Kuwait (5.4%, a difference of 0.0%), Indian (Asian) (5.4%, a difference of 0.020%), Immigrants from Sri Lanka (5.4%, a difference of 0.12%), Immigrants from Ethiopia (5.4%, a difference of 0.13%), and Immigrants from Israel (5.4%, a difference of 0.37%).
| Demographics | Rating | Rank | Ambulatory Disability |
| Burmese | 100.0 /100 | #13 | Exceptional 5.3% |
| Immigrants | Eastern Asia | 100.0 /100 | #14 | Exceptional 5.3% |
| Immigrants | China | 100.0 /100 | #15 | Exceptional 5.3% |
| Immigrants | Hong Kong | 100.0 /100 | #16 | Exceptional 5.3% |
| Immigrants | Ethiopia | 100.0 /100 | #17 | Exceptional 5.4% |
| Immigrants | Sri Lanka | 100.0 /100 | #18 | Exceptional 5.4% |
| Indians (Asian) | 100.0 /100 | #19 | Exceptional 5.4% |
| Ethiopians | 100.0 /100 | #20 | Exceptional 5.4% |
| Immigrants | Kuwait | 100.0 /100 | #21 | Exceptional 5.4% |
| Immigrants | Israel | 100.0 /100 | #22 | Exceptional 5.4% |
| Tongans | 100.0 /100 | #23 | Exceptional 5.4% |
| Immigrants | Saudi Arabia | 100.0 /100 | #24 | Exceptional 5.4% |
| Zimbabweans | 100.0 /100 | #25 | Exceptional 5.4% |
| Immigrants | Nepal | 100.0 /100 | #26 | Exceptional 5.4% |
| Asians | 100.0 /100 | #27 | Exceptional 5.4% |
Demographics Similar to Immigrants from Kenya by Ambulatory Disability
In terms of ambulatory disability, the demographic groups most similar to Immigrants from Kenya are Immigrants from Romania (5.8%, a difference of 0.070%), Immigrants from Serbia (5.8%, a difference of 0.080%), Immigrants from South America (5.8%, a difference of 0.080%), New Zealander (5.8%, a difference of 0.13%), and Immigrants from Czechoslovakia (5.8%, a difference of 0.24%).
| Demographics | Rating | Rank | Ambulatory Disability |
| Immigrants | El Salvador | 98.4 /100 | #95 | Exceptional 5.8% |
| Salvadorans | 98.4 /100 | #96 | Exceptional 5.8% |
| Immigrants | Somalia | 98.3 /100 | #97 | Exceptional 5.8% |
| Immigrants | Lebanon | 98.3 /100 | #98 | Exceptional 5.8% |
| Immigrants | Northern Europe | 98.2 /100 | #99 | Exceptional 5.8% |
| Immigrants | Serbia | 97.9 /100 | #100 | Exceptional 5.8% |
| Immigrants | South America | 97.9 /100 | #101 | Exceptional 5.8% |
| Immigrants | Kenya | 97.8 /100 | #102 | Exceptional 5.8% |
| Immigrants | Romania | 97.7 /100 | #103 | Exceptional 5.8% |
| New Zealanders | 97.6 /100 | #104 | Exceptional 5.8% |
| Immigrants | Czechoslovakia | 97.4 /100 | #105 | Exceptional 5.8% |
| Immigrants | Morocco | 97.3 /100 | #106 | Exceptional 5.8% |
| Uruguayans | 97.2 /100 | #107 | Exceptional 5.8% |
| Colombians | 97.2 /100 | #108 | Exceptional 5.8% |
| Immigrants | Netherlands | 97.1 /100 | #109 | Exceptional 5.8% |