Estonian vs Palestinian Disability Age 5 to 17
COMPARE
Estonian
Palestinian
Disability Age 5 to 17
Disability Age 5 to 17 Comparison
Estonians
Palestinians
5.5%
DISABILITY AGE 5 TO 17
80.8/ 100
METRIC RATING
151st/ 347
METRIC RANK
5.2%
DISABILITY AGE 5 TO 17
99.8/ 100
METRIC RATING
66th/ 347
METRIC RANK
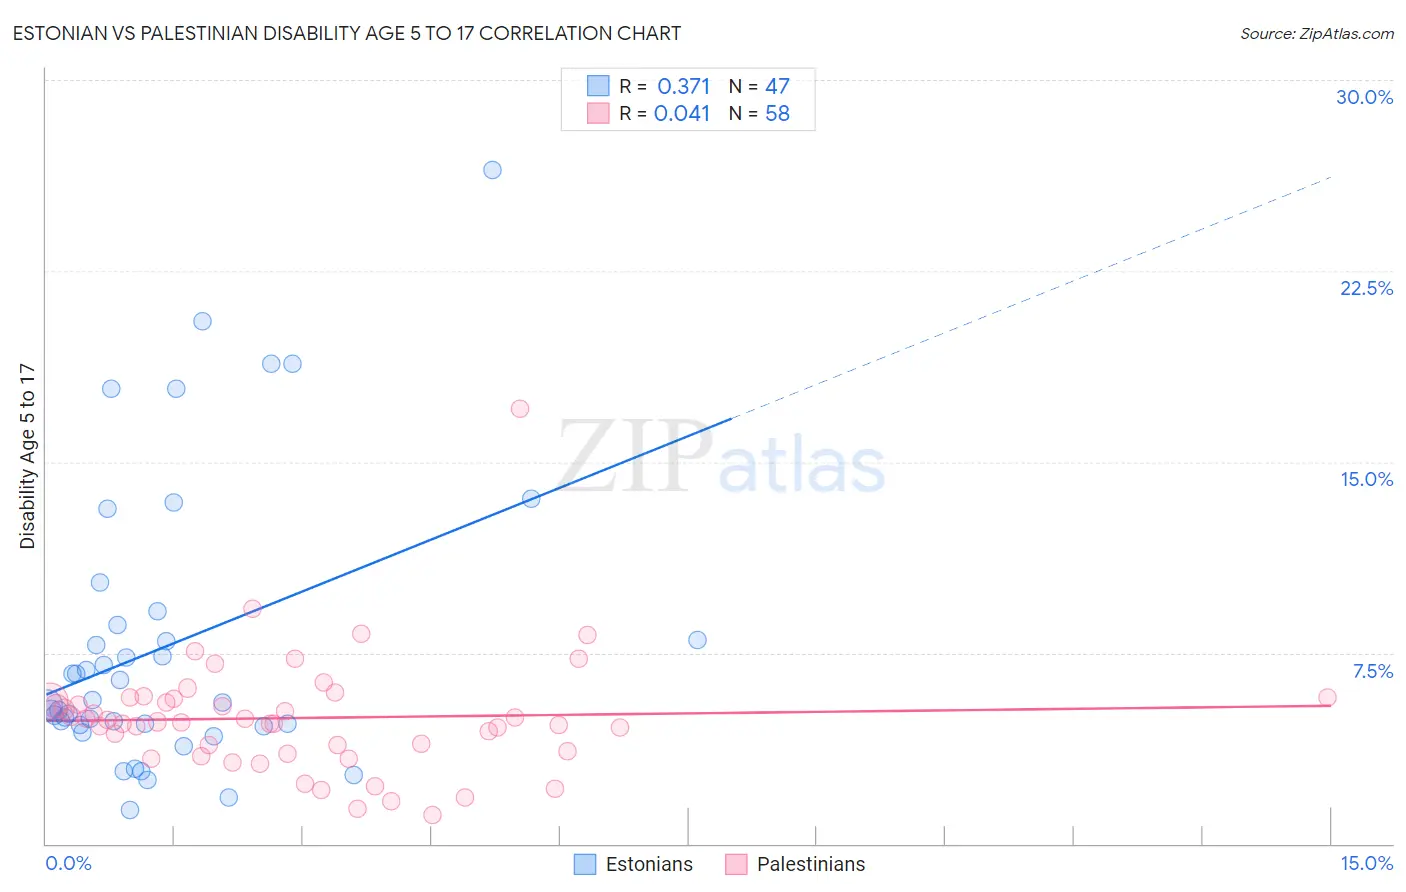
Estonian vs Palestinian Disability Age 5 to 17 Correlation Chart
The statistical analysis conducted on geographies consisting of 122,980,183 people shows a mild positive correlation between the proportion of Estonians and percentage of population with a disability between the ages 5 and 17 in the United States with a correlation coefficient (R) of 0.371 and weighted average of 5.5%. Similarly, the statistical analysis conducted on geographies consisting of 215,847,606 people shows no correlation between the proportion of Palestinians and percentage of population with a disability between the ages 5 and 17 in the United States with a correlation coefficient (R) of 0.041 and weighted average of 5.2%, a difference of 6.2%.
Disability Age 5 to 17 Correlation Summary
| Measurement | Estonian | Palestinian |
| Minimum | 1.3% | 1.1% |
| Maximum | 26.5% | 17.1% |
| Range | 25.2% | 15.9% |
| Mean | 7.8% | 4.9% |
| Median | 5.5% | 4.8% |
| Interquartile 25% (IQ1) | 4.7% | 3.6% |
| Interquartile 75% (IQ3) | 8.6% | 5.7% |
| Interquartile Range (IQR) | 3.9% | 2.1% |
| Standard Deviation (Sample) | 5.6% | 2.4% |
| Standard Deviation (Population) | 5.5% | 2.3% |
Similar Demographics by Disability Age 5 to 17
Demographics Similar to Estonians by Disability Age 5 to 17
In terms of disability age 5 to 17, the demographic groups most similar to Estonians are Ute (5.5%, a difference of 0.010%), Guatemalan (5.5%, a difference of 0.060%), Central American (5.5%, a difference of 0.070%), Ecuadorian (5.5%, a difference of 0.080%), and Samoan (5.5%, a difference of 0.10%).
| Demographics | Rating | Rank | Disability Age 5 to 17 |
| Pakistanis | 87.3 /100 | #144 | Excellent 5.5% |
| Immigrants | Guatemala | 86.6 /100 | #145 | Excellent 5.5% |
| Albanians | 83.7 /100 | #146 | Excellent 5.5% |
| Immigrants | Albania | 83.1 /100 | #147 | Excellent 5.5% |
| Samoans | 81.9 /100 | #148 | Excellent 5.5% |
| Central Americans | 81.6 /100 | #149 | Excellent 5.5% |
| Guatemalans | 81.5 /100 | #150 | Excellent 5.5% |
| Estonians | 80.8 /100 | #151 | Excellent 5.5% |
| Ute | 80.6 /100 | #152 | Excellent 5.5% |
| Ecuadorians | 79.7 /100 | #153 | Good 5.5% |
| Australians | 78.8 /100 | #154 | Good 5.5% |
| Immigrants | Ecuador | 78.3 /100 | #155 | Good 5.5% |
| Hawaiians | 78.0 /100 | #156 | Good 5.5% |
| Immigrants | Costa Rica | 77.9 /100 | #157 | Good 5.5% |
| Immigrants | Nepal | 77.1 /100 | #158 | Good 5.5% |
Demographics Similar to Palestinians by Disability Age 5 to 17
In terms of disability age 5 to 17, the demographic groups most similar to Palestinians are Macedonian (5.2%, a difference of 0.030%), Immigrants from Greece (5.2%, a difference of 0.040%), Immigrants from South Eastern Asia (5.2%, a difference of 0.060%), Immigrants from Bangladesh (5.2%, a difference of 0.090%), and Immigrants from Syria (5.2%, a difference of 0.17%).
| Demographics | Rating | Rank | Disability Age 5 to 17 |
| Immigrants | North Macedonia | 99.9 /100 | #59 | Exceptional 5.1% |
| Immigrants | Eastern Europe | 99.9 /100 | #60 | Exceptional 5.1% |
| Immigrants | Switzerland | 99.8 /100 | #61 | Exceptional 5.2% |
| Immigrants | Ireland | 99.8 /100 | #62 | Exceptional 5.2% |
| Immigrants | Bangladesh | 99.8 /100 | #63 | Exceptional 5.2% |
| Immigrants | South Eastern Asia | 99.8 /100 | #64 | Exceptional 5.2% |
| Immigrants | Greece | 99.8 /100 | #65 | Exceptional 5.2% |
| Palestinians | 99.8 /100 | #66 | Exceptional 5.2% |
| Macedonians | 99.8 /100 | #67 | Exceptional 5.2% |
| Immigrants | Syria | 99.7 /100 | #68 | Exceptional 5.2% |
| Guyanese | 99.7 /100 | #69 | Exceptional 5.2% |
| Immigrants | Belgium | 99.7 /100 | #70 | Exceptional 5.2% |
| Jordanians | 99.7 /100 | #71 | Exceptional 5.2% |
| Immigrants | Vietnam | 99.7 /100 | #72 | Exceptional 5.2% |
| Immigrants | Czechoslovakia | 99.7 /100 | #73 | Exceptional 5.2% |