Estonian vs Immigrants from Oceania 10th Grade
COMPARE
Estonian
Immigrants from Oceania
10th Grade
10th Grade Comparison
Estonians
Immigrants from Oceania
95.3%
10TH GRADE
99.9/ 100
METRIC RATING
35th/ 347
METRIC RANK
93.4%
10TH GRADE
15.1/ 100
METRIC RATING
215th/ 347
METRIC RANK
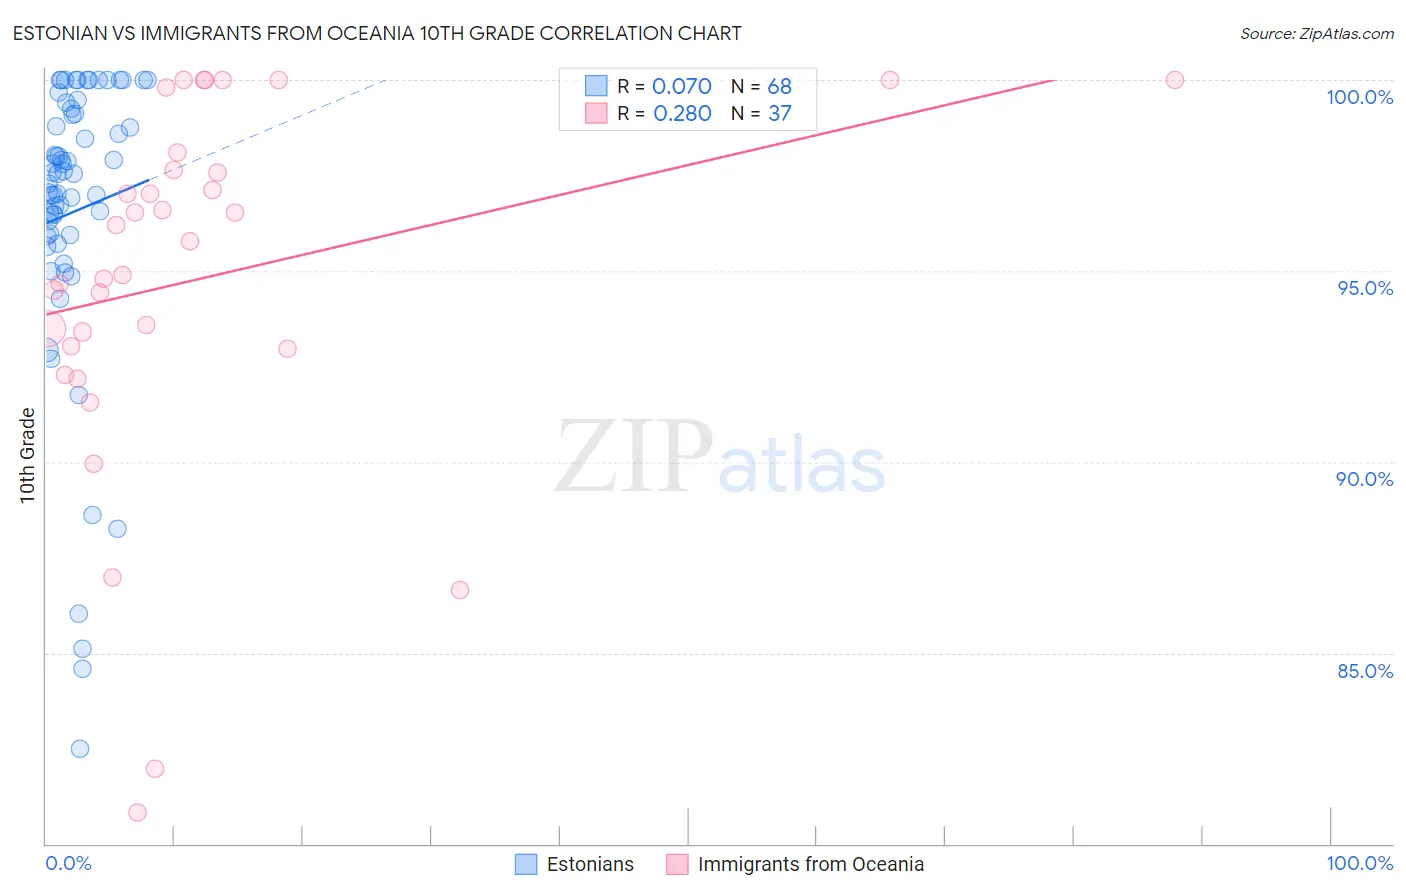
Estonian vs Immigrants from Oceania 10th Grade Correlation Chart
The statistical analysis conducted on geographies consisting of 123,528,404 people shows a slight positive correlation between the proportion of Estonians and percentage of population with at least 10th grade education in the United States with a correlation coefficient (R) of 0.070 and weighted average of 95.3%. Similarly, the statistical analysis conducted on geographies consisting of 305,521,521 people shows a weak positive correlation between the proportion of Immigrants from Oceania and percentage of population with at least 10th grade education in the United States with a correlation coefficient (R) of 0.280 and weighted average of 93.4%, a difference of 2.1%.
10th Grade Correlation Summary
| Measurement | Estonian | Immigrants from Oceania |
| Minimum | 82.5% | 80.8% |
| Maximum | 100.0% | 100.0% |
| Range | 17.5% | 19.2% |
| Mean | 96.5% | 94.8% |
| Median | 97.5% | 95.8% |
| Interquartile 25% (IQ1) | 95.9% | 93.0% |
| Interquartile 75% (IQ3) | 99.2% | 97.9% |
| Interquartile Range (IQR) | 3.3% | 4.9% |
| Standard Deviation (Sample) | 3.9% | 4.8% |
| Standard Deviation (Population) | 3.9% | 4.7% |
Similar Demographics by 10th Grade
Demographics Similar to Estonians by 10th Grade
In terms of 10th grade, the demographic groups most similar to Estonians are British (95.3%, a difference of 0.010%), Immigrants from India (95.3%, a difference of 0.010%), Iranian (95.3%, a difference of 0.020%), Hungarian (95.3%, a difference of 0.020%), and French (95.3%, a difference of 0.020%).
| Demographics | Rating | Rank | 10th Grade |
| Luxembourgers | 100.0 /100 | #28 | Exceptional 95.4% |
| Bulgarians | 100.0 /100 | #29 | Exceptional 95.4% |
| Belgians | 100.0 /100 | #30 | Exceptional 95.4% |
| Iranians | 100.0 /100 | #31 | Exceptional 95.3% |
| Hungarians | 100.0 /100 | #32 | Exceptional 95.3% |
| French | 100.0 /100 | #33 | Exceptional 95.3% |
| British | 99.9 /100 | #34 | Exceptional 95.3% |
| Estonians | 99.9 /100 | #35 | Exceptional 95.3% |
| Immigrants | India | 99.9 /100 | #36 | Exceptional 95.3% |
| French Canadians | 99.9 /100 | #37 | Exceptional 95.3% |
| Northern Europeans | 99.9 /100 | #38 | Exceptional 95.3% |
| Immigrants | Scotland | 99.9 /100 | #39 | Exceptional 95.2% |
| Scotch-Irish | 99.9 /100 | #40 | Exceptional 95.2% |
| Russians | 99.9 /100 | #41 | Exceptional 95.2% |
| Slavs | 99.9 /100 | #42 | Exceptional 95.2% |
Demographics Similar to Immigrants from Oceania by 10th Grade
In terms of 10th grade, the demographic groups most similar to Immigrants from Oceania are Immigrants from Bahamas (93.4%, a difference of 0.0%), Immigrants from Asia (93.4%, a difference of 0.010%), Immigrants from Eastern Africa (93.4%, a difference of 0.010%), Cajun (93.4%, a difference of 0.030%), and Immigrants from Zaire (93.4%, a difference of 0.030%).
| Demographics | Rating | Rank | 10th Grade |
| Immigrants | Syria | 19.4 /100 | #208 | Poor 93.4% |
| Immigrants | Chile | 18.8 /100 | #209 | Poor 93.4% |
| Indians (Asian) | 17.6 /100 | #210 | Poor 93.4% |
| Cajuns | 16.9 /100 | #211 | Poor 93.4% |
| Immigrants | Zaire | 16.7 /100 | #212 | Poor 93.4% |
| Immigrants | Asia | 15.7 /100 | #213 | Poor 93.4% |
| Immigrants | Bahamas | 15.2 /100 | #214 | Poor 93.4% |
| Immigrants | Oceania | 15.1 /100 | #215 | Poor 93.4% |
| Immigrants | Eastern Africa | 14.7 /100 | #216 | Poor 93.4% |
| Portuguese | 12.1 /100 | #217 | Poor 93.3% |
| Immigrants | Liberia | 10.2 /100 | #218 | Poor 93.3% |
| Seminole | 10.2 /100 | #219 | Poor 93.3% |
| Tongans | 9.5 /100 | #220 | Tragic 93.3% |
| Immigrants | Southern Europe | 8.9 /100 | #221 | Tragic 93.2% |
| Ethiopians | 7.9 /100 | #222 | Tragic 93.2% |