Estonian vs Honduran Female Disability
COMPARE
Estonian
Honduran
Female Disability
Female Disability Comparison
Estonians
Hondurans
12.0%
FEMALE DISABILITY
87.8/ 100
METRIC RATING
145th/ 347
METRIC RANK
12.3%
FEMALE DISABILITY
25.4/ 100
METRIC RATING
197th/ 347
METRIC RANK
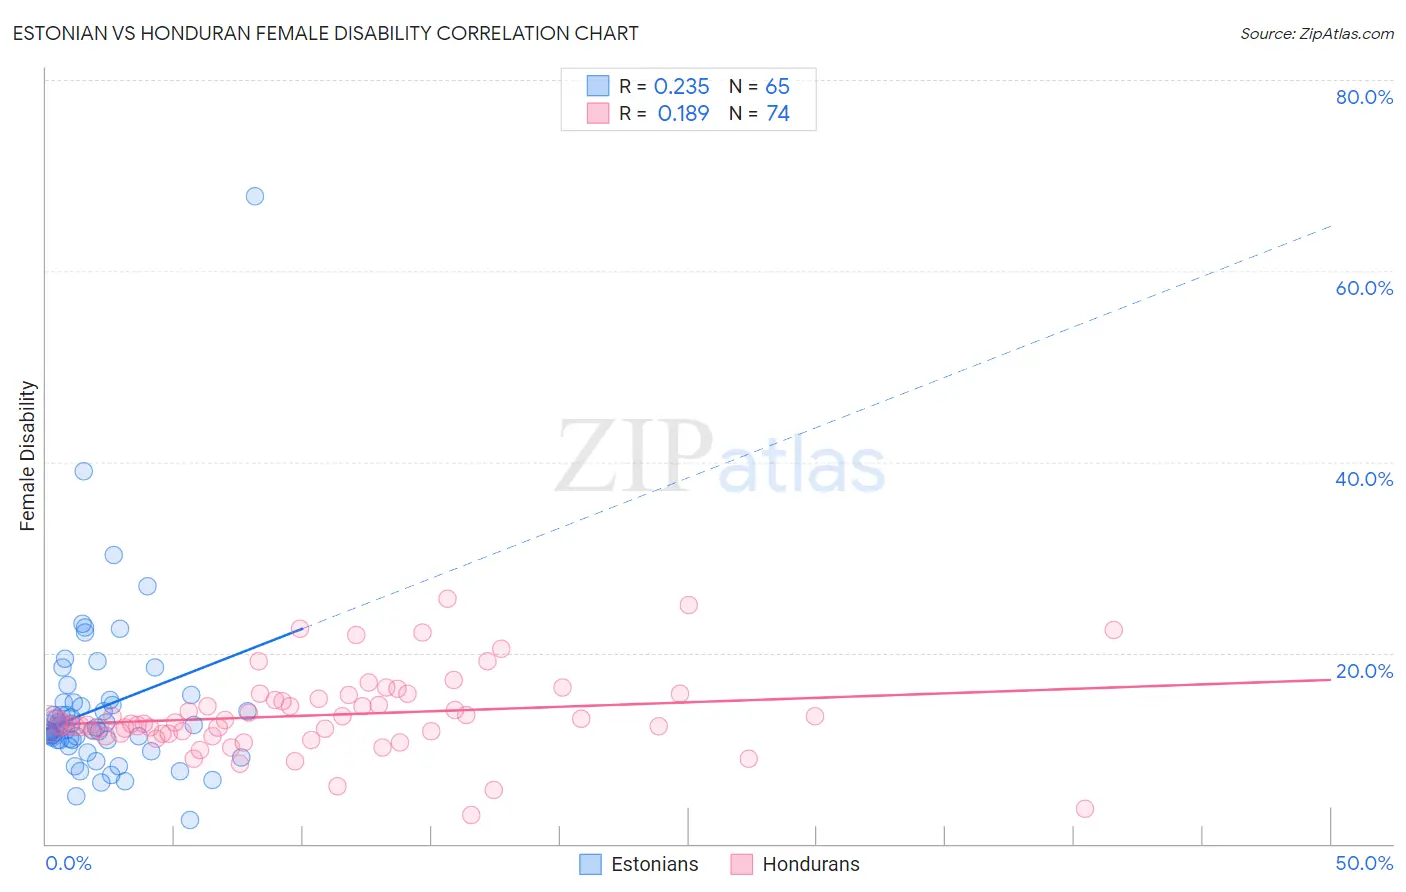
Estonian vs Honduran Female Disability Correlation Chart
The statistical analysis conducted on geographies consisting of 123,526,359 people shows a weak positive correlation between the proportion of Estonians and percentage of females with a disability in the United States with a correlation coefficient (R) of 0.235 and weighted average of 12.0%. Similarly, the statistical analysis conducted on geographies consisting of 357,759,826 people shows a poor positive correlation between the proportion of Hondurans and percentage of females with a disability in the United States with a correlation coefficient (R) of 0.189 and weighted average of 12.3%, a difference of 2.9%.
Female Disability Correlation Summary
| Measurement | Estonian | Honduran |
| Minimum | 2.4% | 3.1% |
| Maximum | 67.8% | 25.7% |
| Range | 65.4% | 22.6% |
| Mean | 14.2% | 13.5% |
| Median | 12.1% | 12.6% |
| Interquartile 25% (IQ1) | 10.8% | 11.6% |
| Interquartile 75% (IQ3) | 14.8% | 15.2% |
| Interquartile Range (IQR) | 3.9% | 3.6% |
| Standard Deviation (Sample) | 9.0% | 4.2% |
| Standard Deviation (Population) | 8.9% | 4.2% |
Similar Demographics by Female Disability
Demographics Similar to Estonians by Female Disability
In terms of female disability, the demographic groups most similar to Estonians are Immigrants from Austria (12.0%, a difference of 0.0%), Immigrants from Sudan (11.9%, a difference of 0.17%), Immigrants from Africa (11.9%, a difference of 0.21%), Pakistani (12.0%, a difference of 0.26%), and Nigerian (12.0%, a difference of 0.30%).
| Demographics | Rating | Rank | Female Disability |
| Ecuadorians | 93.4 /100 | #138 | Exceptional 11.9% |
| Immigrants | Hungary | 92.8 /100 | #139 | Exceptional 11.9% |
| Romanians | 91.6 /100 | #140 | Exceptional 11.9% |
| Immigrants | Ecuador | 91.5 /100 | #141 | Exceptional 11.9% |
| Immigrants | Africa | 90.0 /100 | #142 | Excellent 11.9% |
| Immigrants | Sudan | 89.6 /100 | #143 | Excellent 11.9% |
| Immigrants | Austria | 87.9 /100 | #144 | Excellent 12.0% |
| Estonians | 87.8 /100 | #145 | Excellent 12.0% |
| Pakistanis | 84.6 /100 | #146 | Excellent 12.0% |
| Nigerians | 84.0 /100 | #147 | Excellent 12.0% |
| Immigrants | Kenya | 83.1 /100 | #148 | Excellent 12.0% |
| Greeks | 82.0 /100 | #149 | Excellent 12.0% |
| Immigrants | Moldova | 81.4 /100 | #150 | Excellent 12.0% |
| Icelanders | 80.7 /100 | #151 | Excellent 12.0% |
| Immigrants | Scotland | 79.3 /100 | #152 | Good 12.0% |
Demographics Similar to Hondurans by Female Disability
In terms of female disability, the demographic groups most similar to Hondurans are Immigrants from Panama (12.3%, a difference of 0.0%), Mexican American Indian (12.3%, a difference of 0.030%), Immigrants from Trinidad and Tobago (12.3%, a difference of 0.040%), Swedish (12.3%, a difference of 0.060%), and Ukrainian (12.3%, a difference of 0.080%).
| Demographics | Rating | Rank | Female Disability |
| Immigrants | Honduras | 31.3 /100 | #190 | Fair 12.3% |
| Armenians | 29.7 /100 | #191 | Fair 12.3% |
| Immigrants | Western Africa | 29.2 /100 | #192 | Fair 12.3% |
| Northern Europeans | 27.5 /100 | #193 | Fair 12.3% |
| Ukrainians | 27.2 /100 | #194 | Fair 12.3% |
| Swedes | 26.6 /100 | #195 | Fair 12.3% |
| Immigrants | Panama | 25.5 /100 | #196 | Fair 12.3% |
| Hondurans | 25.4 /100 | #197 | Fair 12.3% |
| Mexican American Indians | 24.9 /100 | #198 | Fair 12.3% |
| Immigrants | Trinidad and Tobago | 24.7 /100 | #199 | Fair 12.3% |
| Trinidadians and Tobagonians | 22.4 /100 | #200 | Fair 12.3% |
| Chinese | 22.1 /100 | #201 | Fair 12.3% |
| Somalis | 21.5 /100 | #202 | Fair 12.3% |
| Immigrants | Barbados | 21.1 /100 | #203 | Fair 12.3% |
| Immigrants | Zaire | 20.9 /100 | #204 | Fair 12.3% |