Estonian vs Tsimshian Disability
COMPARE
Estonian
Tsimshian
Disability
Disability Comparison
Estonians
Tsimshian
11.7%
DISABILITY
54.4/ 100
METRIC RATING
167th/ 347
METRIC RANK
16.1%
DISABILITY
0.0/ 100
METRIC RATING
346th/ 347
METRIC RANK
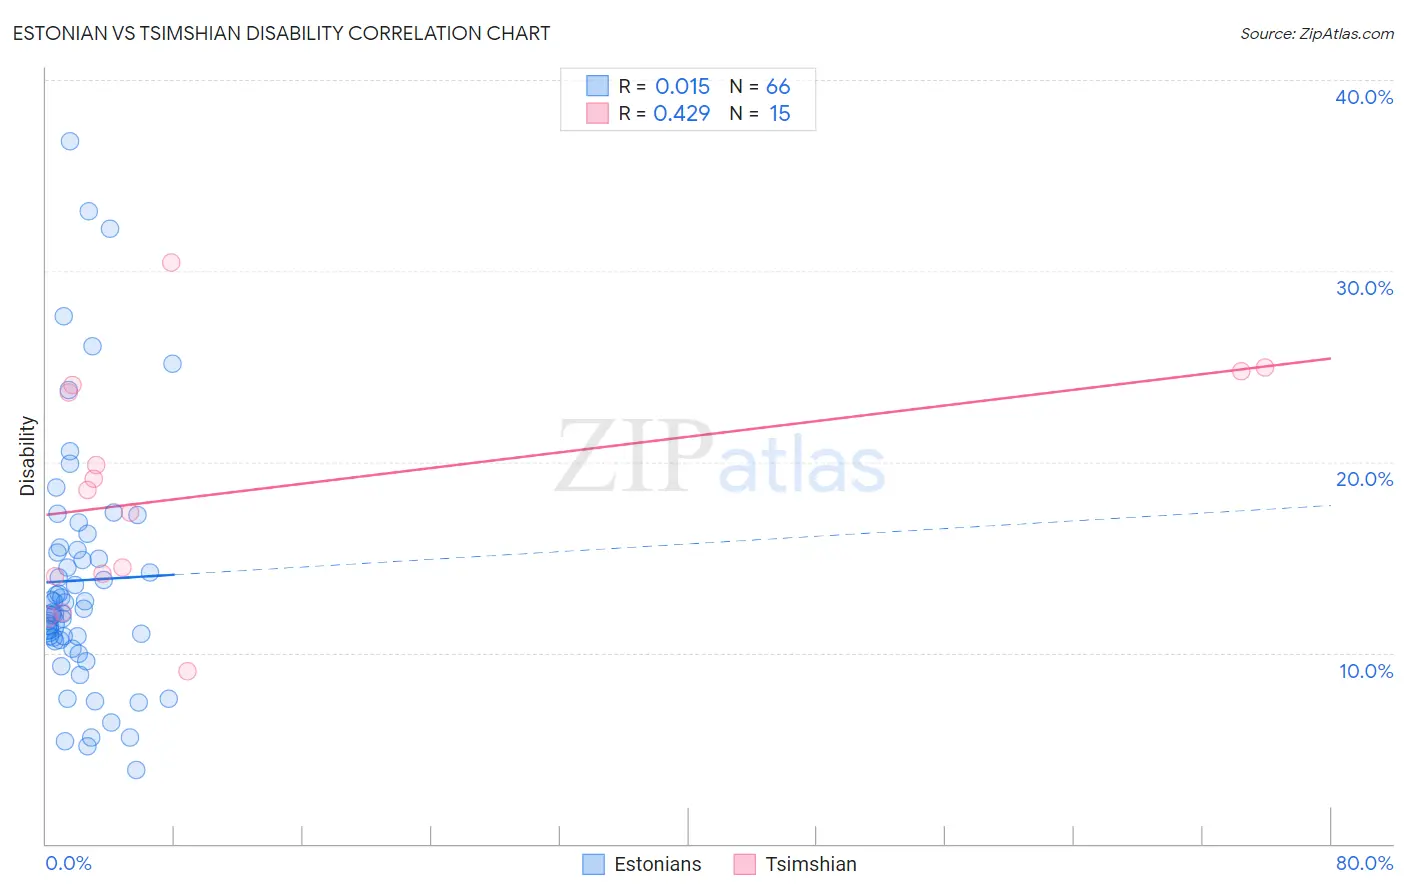
Estonian vs Tsimshian Disability Correlation Chart
The statistical analysis conducted on geographies consisting of 123,527,631 people shows no correlation between the proportion of Estonians and percentage of population with a disability in the United States with a correlation coefficient (R) of 0.015 and weighted average of 11.7%. Similarly, the statistical analysis conducted on geographies consisting of 15,626,544 people shows a moderate positive correlation between the proportion of Tsimshian and percentage of population with a disability in the United States with a correlation coefficient (R) of 0.429 and weighted average of 16.1%, a difference of 38.2%.
Disability Correlation Summary
| Measurement | Estonian | Tsimshian |
| Minimum | 3.8% | 9.0% |
| Maximum | 36.8% | 30.5% |
| Range | 33.0% | 21.5% |
| Mean | 13.8% | 18.5% |
| Median | 12.2% | 18.5% |
| Interquartile 25% (IQ1) | 10.7% | 14.0% |
| Interquartile 75% (IQ3) | 15.4% | 24.0% |
| Interquartile Range (IQR) | 4.8% | 10.0% |
| Standard Deviation (Sample) | 6.6% | 6.1% |
| Standard Deviation (Population) | 6.5% | 5.9% |
Similar Demographics by Disability
Demographics Similar to Estonians by Disability
In terms of disability, the demographic groups most similar to Estonians are Pakistani (11.7%, a difference of 0.010%), Immigrants from Latin America (11.7%, a difference of 0.020%), Immigrants from Austria (11.7%, a difference of 0.050%), Immigrants from Albania (11.7%, a difference of 0.070%), and Immigrants from Southern Europe (11.7%, a difference of 0.070%).
| Demographics | Rating | Rank | Disability |
| Immigrants | Barbados | 64.2 /100 | #160 | Good 11.6% |
| Immigrants | Cuba | 62.8 /100 | #161 | Good 11.6% |
| Immigrants | Haiti | 59.2 /100 | #162 | Average 11.7% |
| Immigrants | Trinidad and Tobago | 58.9 /100 | #163 | Average 11.7% |
| Syrians | 58.5 /100 | #164 | Average 11.7% |
| Cubans | 56.7 /100 | #165 | Average 11.7% |
| Pakistanis | 54.7 /100 | #166 | Average 11.7% |
| Estonians | 54.4 /100 | #167 | Average 11.7% |
| Immigrants | Latin America | 54.1 /100 | #168 | Average 11.7% |
| Immigrants | Austria | 53.4 /100 | #169 | Average 11.7% |
| Immigrants | Albania | 52.8 /100 | #170 | Average 11.7% |
| Immigrants | Southern Europe | 52.8 /100 | #171 | Average 11.7% |
| Trinidadians and Tobagonians | 52.7 /100 | #172 | Average 11.7% |
| Maltese | 50.6 /100 | #173 | Average 11.7% |
| Albanians | 50.0 /100 | #174 | Average 11.7% |
Demographics Similar to Tsimshian by Disability
In terms of disability, the demographic groups most similar to Tsimshian are Puerto Rican (16.1%, a difference of 0.16%), Colville (15.8%, a difference of 2.2%), Creek (15.6%, a difference of 3.5%), Kiowa (15.6%, a difference of 3.5%), and Lumbee (15.5%, a difference of 3.9%).
| Demographics | Rating | Rank | Disability |
| Cajuns | 0.0 /100 | #333 | Tragic 14.6% |
| Yuman | 0.0 /100 | #334 | Tragic 14.6% |
| Tohono O'odham | 0.0 /100 | #335 | Tragic 14.8% |
| Cherokee | 0.0 /100 | #336 | Tragic 14.8% |
| Seminole | 0.0 /100 | #337 | Tragic 14.9% |
| Dutch West Indians | 0.0 /100 | #338 | Tragic 14.9% |
| Chickasaw | 0.0 /100 | #339 | Tragic 15.2% |
| Choctaw | 0.0 /100 | #340 | Tragic 15.4% |
| Lumbee | 0.0 /100 | #341 | Tragic 15.5% |
| Kiowa | 0.0 /100 | #342 | Tragic 15.6% |
| Creek | 0.0 /100 | #343 | Tragic 15.6% |
| Colville | 0.0 /100 | #344 | Tragic 15.8% |
| Puerto Ricans | 0.0 /100 | #345 | Tragic 16.1% |
| Tsimshian | 0.0 /100 | #346 | Tragic 16.1% |
| Houma | 0.0 /100 | #347 | Tragic 17.1% |