Estonian vs Hopi Householder Income Ages 45 - 64 years
COMPARE
Estonian
Hopi
Householder Income Ages 45 - 64 years
Householder Income Ages 45 - 64 years Comparison
Estonians
Hopi
$114,220
HOUSEHOLDER INCOME AGES 45 - 64 YEARS
99.9/ 100
METRIC RATING
42nd/ 347
METRIC RANK
$75,562
HOUSEHOLDER INCOME AGES 45 - 64 YEARS
0.0/ 100
METRIC RATING
338th/ 347
METRIC RANK
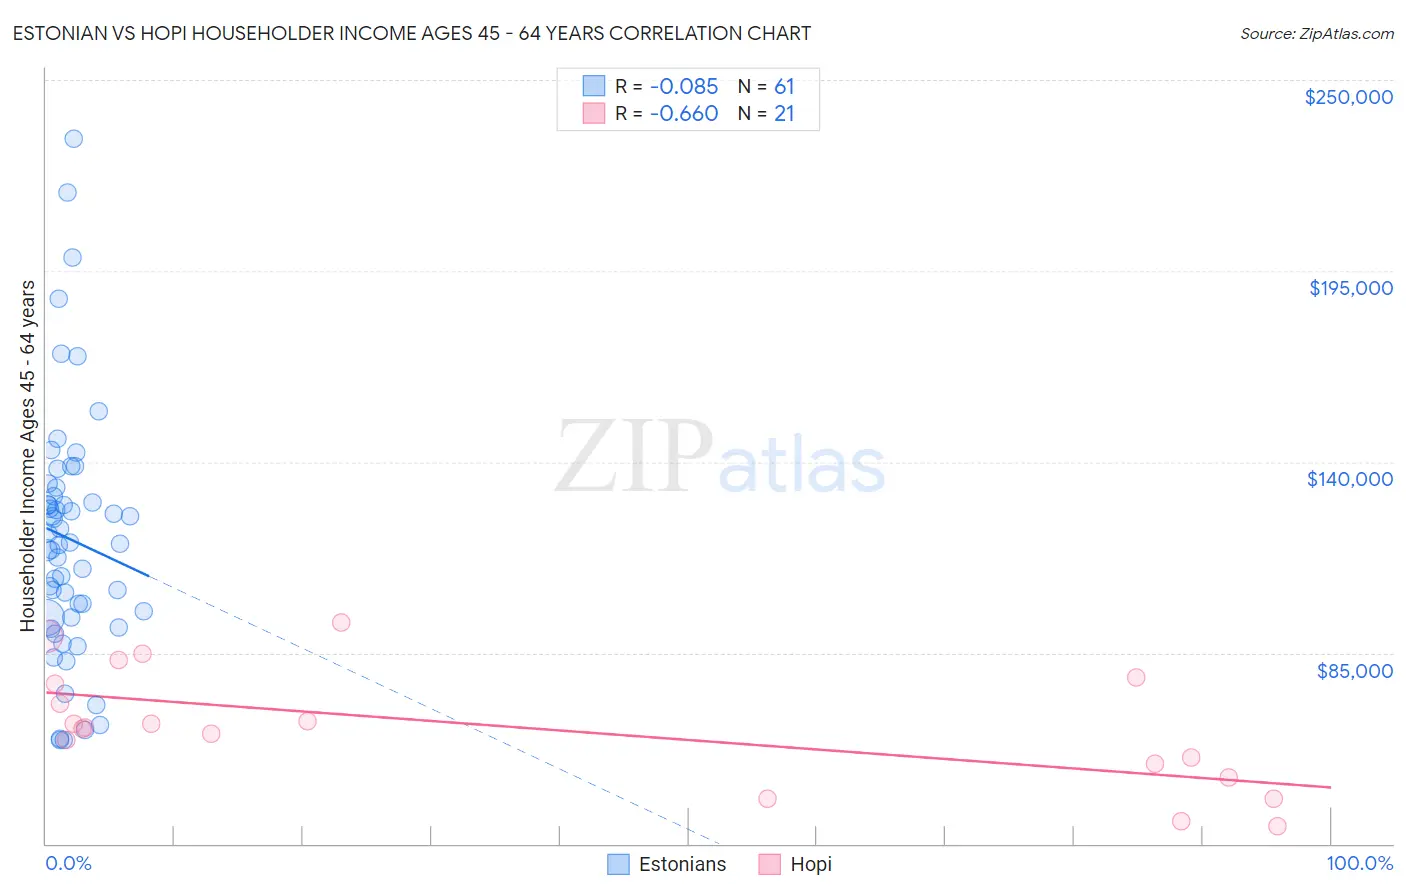
Estonian vs Hopi Householder Income Ages 45 - 64 years Correlation Chart
The statistical analysis conducted on geographies consisting of 123,417,015 people shows a slight negative correlation between the proportion of Estonians and household income with householder between the ages 45 and 64 in the United States with a correlation coefficient (R) of -0.085 and weighted average of $114,220. Similarly, the statistical analysis conducted on geographies consisting of 74,685,429 people shows a significant negative correlation between the proportion of Hopi and household income with householder between the ages 45 and 64 in the United States with a correlation coefficient (R) of -0.660 and weighted average of $75,562, a difference of 51.2%.
Householder Income Ages 45 - 64 years Correlation Summary
| Measurement | Estonian | Hopi |
| Minimum | $59,757 | $34,950 |
| Maximum | $233,125 | $93,766 |
| Range | $173,368 | $58,816 |
| Mean | $117,742 | $63,454 |
| Median | $116,447 | $63,663 |
| Interquartile 25% (IQ1) | $95,098 | $51,066 |
| Interquartile 75% (IQ3) | $131,358 | $76,979 |
| Interquartile Range (IQR) | $36,260 | $25,913 |
| Standard Deviation (Sample) | $35,676 | $16,805 |
| Standard Deviation (Population) | $35,383 | $16,400 |
Similar Demographics by Householder Income Ages 45 - 64 years
Demographics Similar to Estonians by Householder Income Ages 45 - 64 years
In terms of householder income ages 45 - 64 years, the demographic groups most similar to Estonians are Israeli ($114,186, a difference of 0.030%), Immigrants from Lithuania ($114,336, a difference of 0.10%), Cambodian ($114,342, a difference of 0.11%), Immigrants from Turkey ($114,407, a difference of 0.16%), and Immigrants from Pakistan ($114,434, a difference of 0.19%).
| Demographics | Rating | Rank | Householder Income Ages 45 - 64 years |
| Latvians | 100.0 /100 | #35 | Exceptional $115,957 |
| Immigrants | Switzerland | 100.0 /100 | #36 | Exceptional $115,934 |
| Maltese | 99.9 /100 | #37 | Exceptional $114,754 |
| Immigrants | Pakistan | 99.9 /100 | #38 | Exceptional $114,434 |
| Immigrants | Turkey | 99.9 /100 | #39 | Exceptional $114,407 |
| Cambodians | 99.9 /100 | #40 | Exceptional $114,342 |
| Immigrants | Lithuania | 99.9 /100 | #41 | Exceptional $114,336 |
| Estonians | 99.9 /100 | #42 | Exceptional $114,220 |
| Israelis | 99.9 /100 | #43 | Exceptional $114,186 |
| Bulgarians | 99.9 /100 | #44 | Exceptional $113,883 |
| Immigrants | France | 99.9 /100 | #45 | Exceptional $113,680 |
| Immigrants | Greece | 99.9 /100 | #46 | Exceptional $113,548 |
| Australians | 99.9 /100 | #47 | Exceptional $113,533 |
| Immigrants | Indonesia | 99.9 /100 | #48 | Exceptional $113,519 |
| Immigrants | Russia | 99.8 /100 | #49 | Exceptional $113,215 |
Demographics Similar to Hopi by Householder Income Ages 45 - 64 years
In terms of householder income ages 45 - 64 years, the demographic groups most similar to Hopi are Pueblo ($75,601, a difference of 0.050%), Arapaho ($75,945, a difference of 0.51%), Kiowa ($74,815, a difference of 1.0%), Cheyenne ($76,362, a difference of 1.1%), and Immigrants from Yemen ($74,575, a difference of 1.3%).
| Demographics | Rating | Rank | Householder Income Ages 45 - 64 years |
| Immigrants | Dominican Republic | 0.0 /100 | #331 | Tragic $78,836 |
| Blacks/African Americans | 0.0 /100 | #332 | Tragic $78,556 |
| Immigrants | Congo | 0.0 /100 | #333 | Tragic $77,850 |
| Menominee | 0.0 /100 | #334 | Tragic $76,903 |
| Cheyenne | 0.0 /100 | #335 | Tragic $76,362 |
| Arapaho | 0.0 /100 | #336 | Tragic $75,945 |
| Pueblo | 0.0 /100 | #337 | Tragic $75,601 |
| Hopi | 0.0 /100 | #338 | Tragic $75,562 |
| Kiowa | 0.0 /100 | #339 | Tragic $74,815 |
| Immigrants | Yemen | 0.0 /100 | #340 | Tragic $74,575 |
| Crow | 0.0 /100 | #341 | Tragic $74,257 |
| Tohono O'odham | 0.0 /100 | #342 | Tragic $73,774 |
| Pima | 0.0 /100 | #343 | Tragic $73,365 |
| Houma | 0.0 /100 | #344 | Tragic $72,093 |
| Navajo | 0.0 /100 | #345 | Tragic $69,759 |