Estonian vs Hopi Vision Disability
COMPARE
Estonian
Hopi
Vision Disability
Vision Disability Comparison
Estonians
Hopi
2.1%
VISION DISABILITY
95.3/ 100
METRIC RATING
99th/ 347
METRIC RANK
2.9%
VISION DISABILITY
0.0/ 100
METRIC RATING
324th/ 347
METRIC RANK
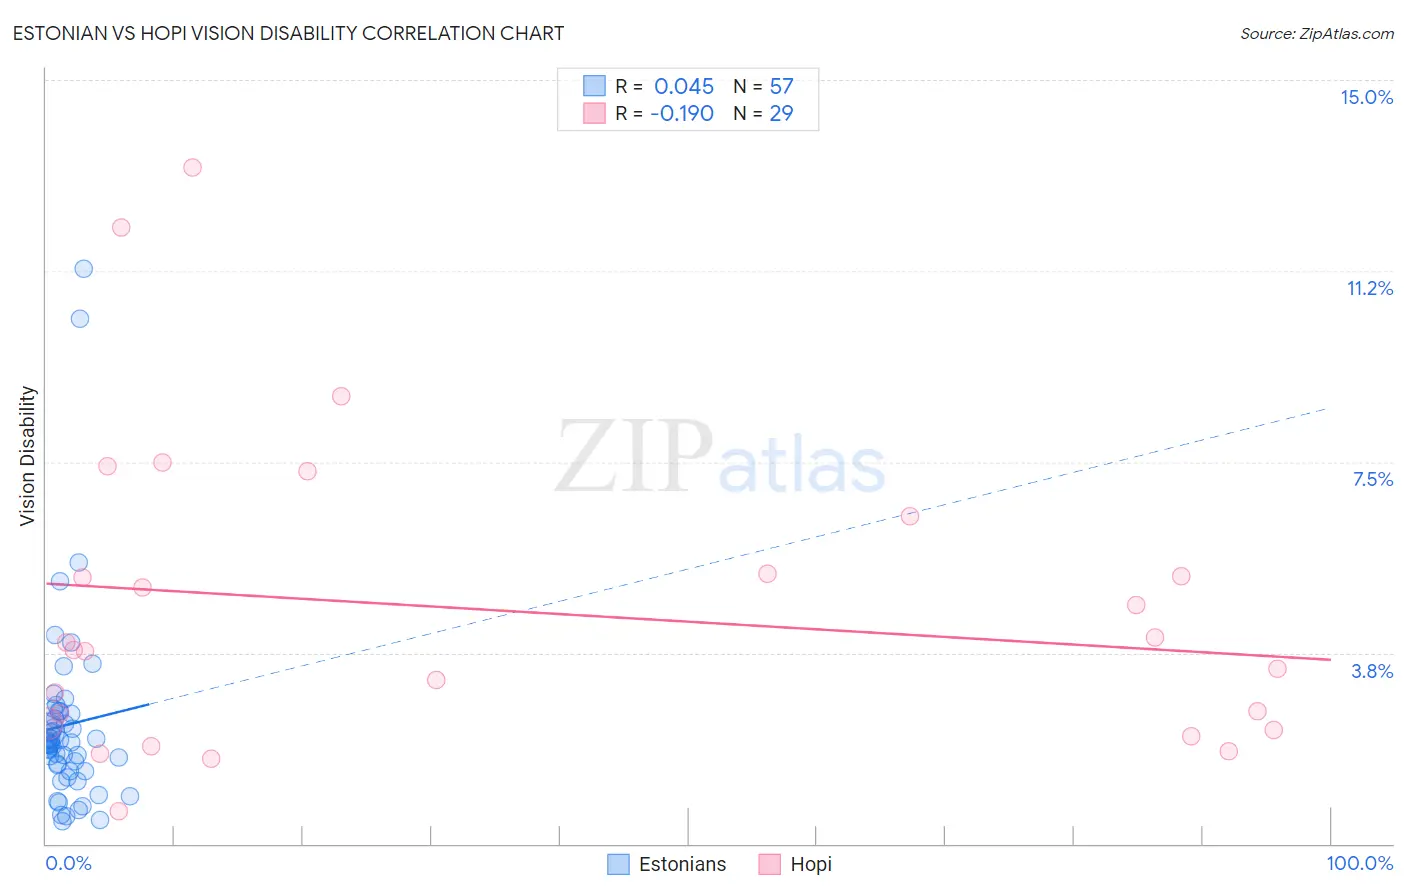
Estonian vs Hopi Vision Disability Correlation Chart
The statistical analysis conducted on geographies consisting of 123,516,084 people shows no correlation between the proportion of Estonians and percentage of population with vision disability in the United States with a correlation coefficient (R) of 0.045 and weighted average of 2.1%. Similarly, the statistical analysis conducted on geographies consisting of 74,725,197 people shows a poor negative correlation between the proportion of Hopi and percentage of population with vision disability in the United States with a correlation coefficient (R) of -0.190 and weighted average of 2.9%, a difference of 41.0%.
Vision Disability Correlation Summary
| Measurement | Estonian | Hopi |
| Minimum | 0.45% | 0.64% |
| Maximum | 11.3% | 13.3% |
| Range | 10.8% | 12.6% |
| Mean | 2.3% | 4.6% |
| Median | 2.0% | 3.8% |
| Interquartile 25% (IQ1) | 1.4% | 2.3% |
| Interquartile 75% (IQ3) | 2.6% | 5.9% |
| Interquartile Range (IQR) | 1.1% | 3.6% |
| Standard Deviation (Sample) | 1.9% | 3.0% |
| Standard Deviation (Population) | 1.9% | 3.0% |
Similar Demographics by Vision Disability
Demographics Similar to Estonians by Vision Disability
In terms of vision disability, the demographic groups most similar to Estonians are Greek (2.1%, a difference of 0.040%), Immigrants from South Africa (2.1%, a difference of 0.070%), Immigrants from Afghanistan (2.1%, a difference of 0.12%), Albanian (2.1%, a difference of 0.12%), and Sri Lankan (2.1%, a difference of 0.15%).
| Demographics | Rating | Rank | Vision Disability |
| Immigrants | Syria | 96.2 /100 | #92 | Exceptional 2.1% |
| Immigrants | Europe | 96.1 /100 | #93 | Exceptional 2.1% |
| Immigrants | Croatia | 96.0 /100 | #94 | Exceptional 2.1% |
| Australians | 95.9 /100 | #95 | Exceptional 2.1% |
| Romanians | 95.7 /100 | #96 | Exceptional 2.1% |
| Immigrants | Afghanistan | 95.6 /100 | #97 | Exceptional 2.1% |
| Immigrants | South Africa | 95.4 /100 | #98 | Exceptional 2.1% |
| Estonians | 95.3 /100 | #99 | Exceptional 2.1% |
| Greeks | 95.1 /100 | #100 | Exceptional 2.1% |
| Albanians | 94.9 /100 | #101 | Exceptional 2.1% |
| Sri Lankans | 94.8 /100 | #102 | Exceptional 2.1% |
| Immigrants | Austria | 94.4 /100 | #103 | Exceptional 2.1% |
| Immigrants | Italy | 94.4 /100 | #104 | Exceptional 2.1% |
| Carpatho Rusyns | 94.3 /100 | #105 | Exceptional 2.1% |
| Swedes | 94.2 /100 | #106 | Exceptional 2.1% |
Demographics Similar to Hopi by Vision Disability
In terms of vision disability, the demographic groups most similar to Hopi are Cherokee (2.9%, a difference of 0.010%), Spanish American (2.9%, a difference of 1.2%), Paiute (2.9%, a difference of 2.0%), Tlingit-Haida (2.9%, a difference of 2.0%), and Native/Alaskan (3.0%, a difference of 2.0%).
| Demographics | Rating | Rank | Vision Disability |
| Yup'ik | 0.0 /100 | #317 | Tragic 2.7% |
| Alaska Natives | 0.0 /100 | #318 | Tragic 2.7% |
| Tohono O'odham | 0.0 /100 | #319 | Tragic 2.8% |
| Blacks/African Americans | 0.0 /100 | #320 | Tragic 2.8% |
| Comanche | 0.0 /100 | #321 | Tragic 2.8% |
| Paiute | 0.0 /100 | #322 | Tragic 2.9% |
| Tlingit-Haida | 0.0 /100 | #323 | Tragic 2.9% |
| Hopi | 0.0 /100 | #324 | Tragic 2.9% |
| Cherokee | 0.0 /100 | #325 | Tragic 2.9% |
| Spanish Americans | 0.0 /100 | #326 | Tragic 2.9% |
| Natives/Alaskans | 0.0 /100 | #327 | Tragic 3.0% |
| Yuman | 0.0 /100 | #328 | Tragic 3.0% |
| Apache | 0.0 /100 | #329 | Tragic 3.0% |
| Colville | 0.0 /100 | #330 | Tragic 3.0% |
| Central American Indians | 0.0 /100 | #331 | Tragic 3.0% |