English vs Immigrants from Zimbabwe Disability Age 5 to 17
COMPARE
English
Immigrants from Zimbabwe
Disability Age 5 to 17
Disability Age 5 to 17 Comparison
English
Immigrants from Zimbabwe
6.2%
DISABILITY AGE 5 TO 17
0.0/ 100
METRIC RATING
285th/ 347
METRIC RANK
5.5%
DISABILITY AGE 5 TO 17
75.3/ 100
METRIC RATING
159th/ 347
METRIC RANK
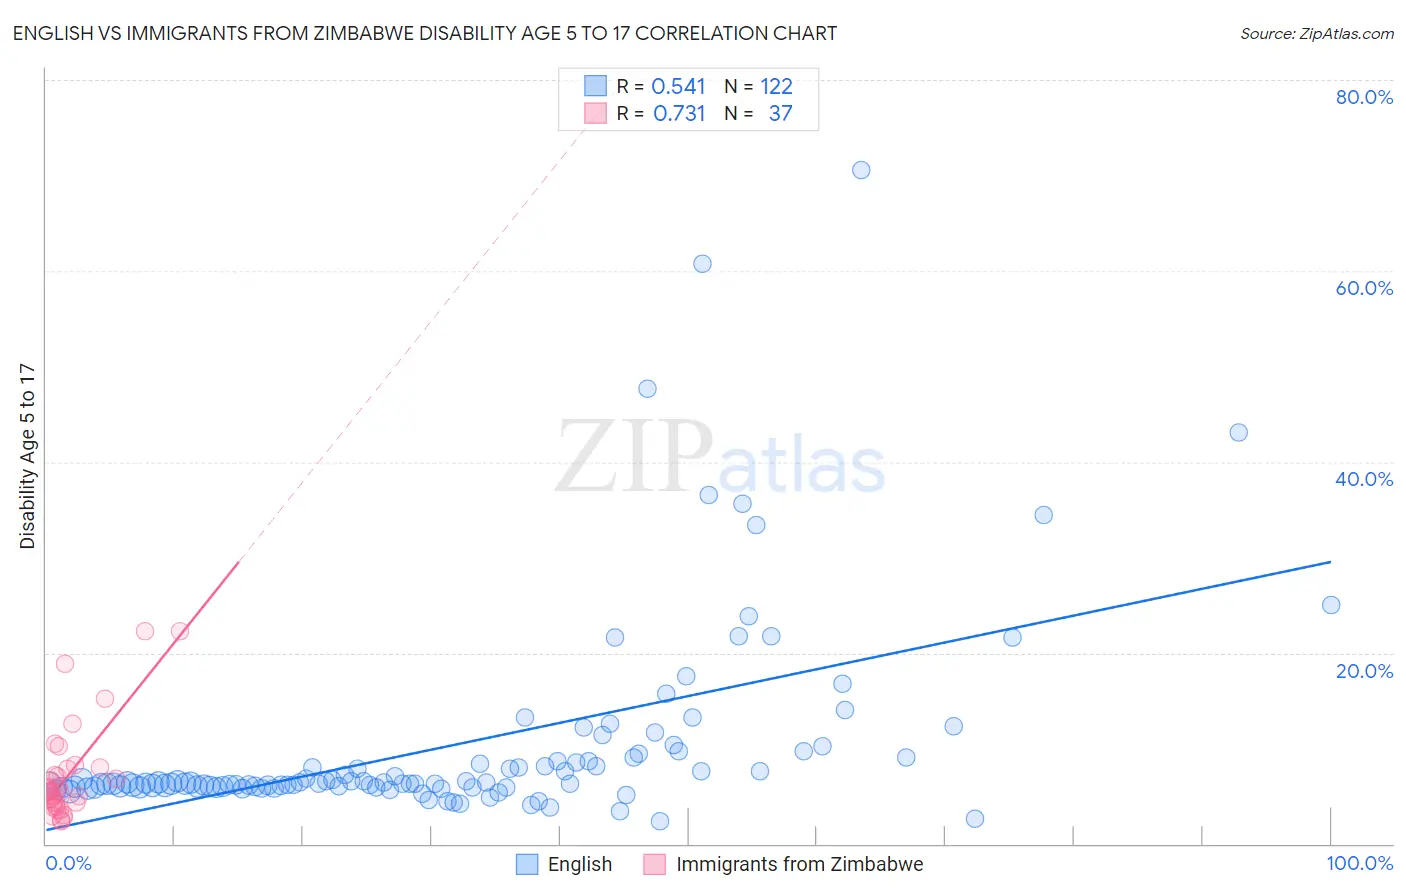
English vs Immigrants from Zimbabwe Disability Age 5 to 17 Correlation Chart
The statistical analysis conducted on geographies consisting of 563,308,437 people shows a substantial positive correlation between the proportion of English and percentage of population with a disability between the ages 5 and 17 in the United States with a correlation coefficient (R) of 0.541 and weighted average of 6.2%. Similarly, the statistical analysis conducted on geographies consisting of 117,554,818 people shows a strong positive correlation between the proportion of Immigrants from Zimbabwe and percentage of population with a disability between the ages 5 and 17 in the United States with a correlation coefficient (R) of 0.731 and weighted average of 5.5%, a difference of 11.5%.
Disability Age 5 to 17 Correlation Summary
| Measurement | English | Immigrants from Zimbabwe |
| Minimum | 2.4% | 2.4% |
| Maximum | 70.5% | 22.2% |
| Range | 68.2% | 19.8% |
| Mean | 10.4% | 7.1% |
| Median | 6.4% | 5.5% |
| Interquartile 25% (IQ1) | 6.0% | 4.1% |
| Interquartile 75% (IQ3) | 9.1% | 7.9% |
| Interquartile Range (IQR) | 3.1% | 3.8% |
| Standard Deviation (Sample) | 10.7% | 5.0% |
| Standard Deviation (Population) | 10.7% | 5.0% |
Similar Demographics by Disability Age 5 to 17
Demographics Similar to English by Disability Age 5 to 17
In terms of disability age 5 to 17, the demographic groups most similar to English are Subsaharan African (6.2%, a difference of 0.0%), Ugandan (6.2%, a difference of 0.030%), Colville (6.2%, a difference of 0.040%), German (6.1%, a difference of 0.19%), and Pima (6.2%, a difference of 0.23%).
| Demographics | Rating | Rank | Disability Age 5 to 17 |
| Immigrants | Liberia | 0.1 /100 | #278 | Tragic 6.1% |
| Immigrants | Jamaica | 0.1 /100 | #279 | Tragic 6.1% |
| Portuguese | 0.1 /100 | #280 | Tragic 6.1% |
| Scottish | 0.0 /100 | #281 | Tragic 6.1% |
| Germans | 0.0 /100 | #282 | Tragic 6.1% |
| Ugandans | 0.0 /100 | #283 | Tragic 6.2% |
| Sub-Saharan Africans | 0.0 /100 | #284 | Tragic 6.2% |
| English | 0.0 /100 | #285 | Tragic 6.2% |
| Colville | 0.0 /100 | #286 | Tragic 6.2% |
| Pima | 0.0 /100 | #287 | Tragic 6.2% |
| Jamaicans | 0.0 /100 | #288 | Tragic 6.2% |
| Yaqui | 0.0 /100 | #289 | Tragic 6.2% |
| Immigrants | Congo | 0.0 /100 | #290 | Tragic 6.2% |
| Whites/Caucasians | 0.0 /100 | #291 | Tragic 6.2% |
| Immigrants | Senegal | 0.0 /100 | #292 | Tragic 6.2% |
Demographics Similar to Immigrants from Zimbabwe by Disability Age 5 to 17
In terms of disability age 5 to 17, the demographic groups most similar to Immigrants from Zimbabwe are Immigrants from Nepal (5.5%, a difference of 0.13%), South African (5.5%, a difference of 0.13%), Immigrants from Costa Rica (5.5%, a difference of 0.18%), Hawaiian (5.5%, a difference of 0.19%), and Immigrants from Ecuador (5.5%, a difference of 0.21%).
| Demographics | Rating | Rank | Disability Age 5 to 17 |
| Ute | 80.6 /100 | #152 | Excellent 5.5% |
| Ecuadorians | 79.7 /100 | #153 | Good 5.5% |
| Australians | 78.8 /100 | #154 | Good 5.5% |
| Immigrants | Ecuador | 78.3 /100 | #155 | Good 5.5% |
| Hawaiians | 78.0 /100 | #156 | Good 5.5% |
| Immigrants | Costa Rica | 77.9 /100 | #157 | Good 5.5% |
| Immigrants | Nepal | 77.1 /100 | #158 | Good 5.5% |
| Immigrants | Zimbabwe | 75.3 /100 | #159 | Good 5.5% |
| South Africans | 73.3 /100 | #160 | Good 5.5% |
| Immigrants | Saudi Arabia | 69.1 /100 | #161 | Good 5.5% |
| Zimbabweans | 67.2 /100 | #162 | Good 5.5% |
| Immigrants | Southern Europe | 64.0 /100 | #163 | Good 5.6% |
| Immigrants | Scotland | 61.9 /100 | #164 | Good 5.6% |
| Lebanese | 61.4 /100 | #165 | Good 5.6% |
| Greeks | 60.6 /100 | #166 | Good 5.6% |