English vs Chippewa Disability Age 5 to 17
COMPARE
English
Chippewa
Disability Age 5 to 17
Disability Age 5 to 17 Comparison
English
Chippewa
6.2%
DISABILITY AGE 5 TO 17
0.0/ 100
METRIC RATING
285th/ 347
METRIC RANK
7.1%
DISABILITY AGE 5 TO 17
0.0/ 100
METRIC RATING
342nd/ 347
METRIC RANK
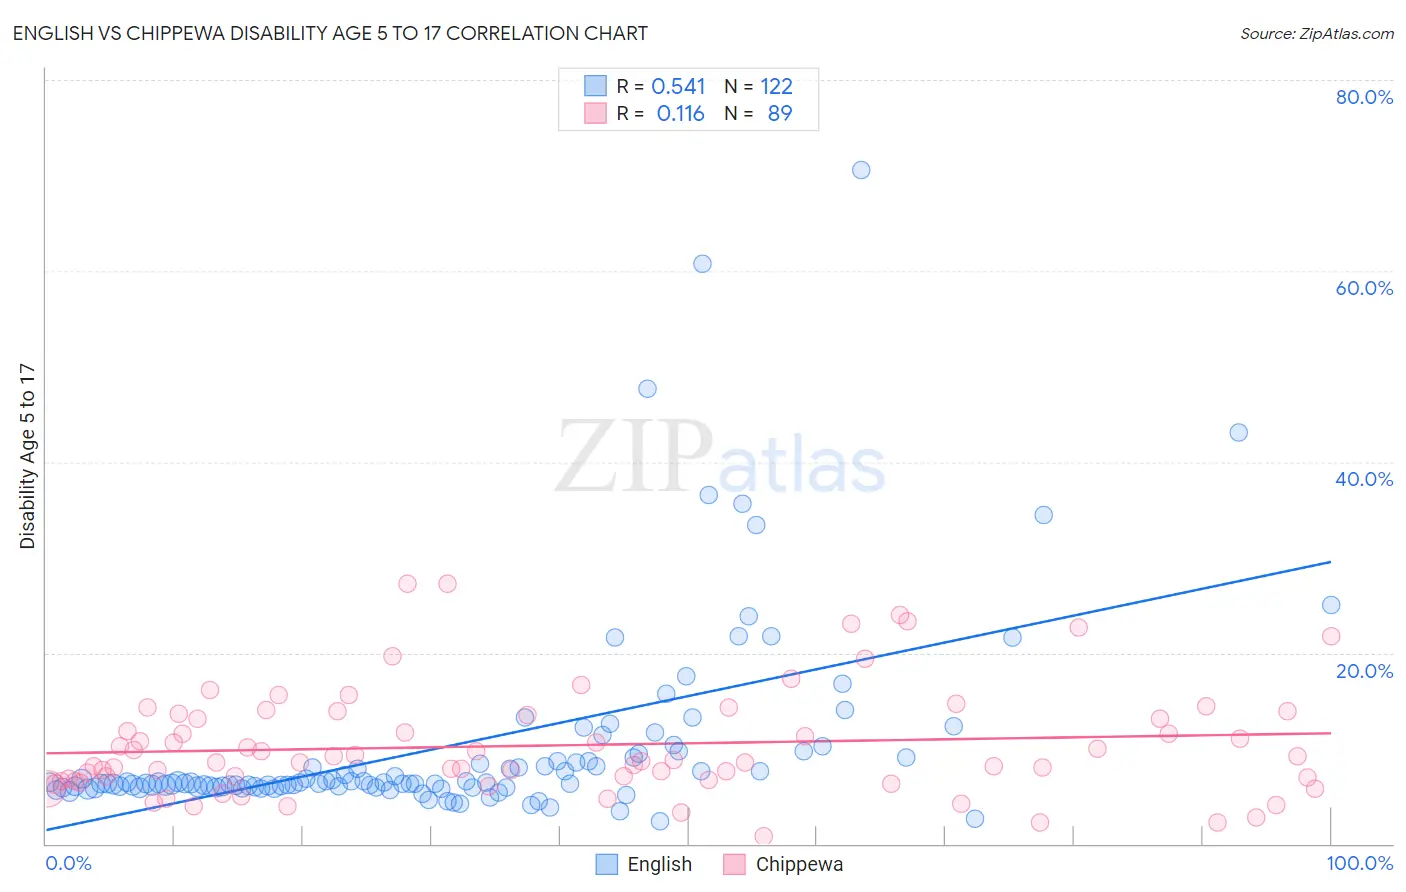
English vs Chippewa Disability Age 5 to 17 Correlation Chart
The statistical analysis conducted on geographies consisting of 563,308,437 people shows a substantial positive correlation between the proportion of English and percentage of population with a disability between the ages 5 and 17 in the United States with a correlation coefficient (R) of 0.541 and weighted average of 6.2%. Similarly, the statistical analysis conducted on geographies consisting of 213,779,900 people shows a poor positive correlation between the proportion of Chippewa and percentage of population with a disability between the ages 5 and 17 in the United States with a correlation coefficient (R) of 0.116 and weighted average of 7.1%, a difference of 15.5%.
Disability Age 5 to 17 Correlation Summary
| Measurement | English | Chippewa |
| Minimum | 2.4% | 0.82% |
| Maximum | 70.5% | 27.3% |
| Range | 68.2% | 26.5% |
| Mean | 10.4% | 10.3% |
| Median | 6.4% | 8.6% |
| Interquartile 25% (IQ1) | 6.0% | 6.6% |
| Interquartile 75% (IQ3) | 9.1% | 13.5% |
| Interquartile Range (IQR) | 3.1% | 6.9% |
| Standard Deviation (Sample) | 10.7% | 5.7% |
| Standard Deviation (Population) | 10.7% | 5.6% |
Similar Demographics by Disability Age 5 to 17
Demographics Similar to English by Disability Age 5 to 17
In terms of disability age 5 to 17, the demographic groups most similar to English are Subsaharan African (6.2%, a difference of 0.0%), Ugandan (6.2%, a difference of 0.030%), Colville (6.2%, a difference of 0.040%), German (6.1%, a difference of 0.19%), and Pima (6.2%, a difference of 0.23%).
| Demographics | Rating | Rank | Disability Age 5 to 17 |
| Immigrants | Liberia | 0.1 /100 | #278 | Tragic 6.1% |
| Immigrants | Jamaica | 0.1 /100 | #279 | Tragic 6.1% |
| Portuguese | 0.1 /100 | #280 | Tragic 6.1% |
| Scottish | 0.0 /100 | #281 | Tragic 6.1% |
| Germans | 0.0 /100 | #282 | Tragic 6.1% |
| Ugandans | 0.0 /100 | #283 | Tragic 6.2% |
| Sub-Saharan Africans | 0.0 /100 | #284 | Tragic 6.2% |
| English | 0.0 /100 | #285 | Tragic 6.2% |
| Colville | 0.0 /100 | #286 | Tragic 6.2% |
| Pima | 0.0 /100 | #287 | Tragic 6.2% |
| Jamaicans | 0.0 /100 | #288 | Tragic 6.2% |
| Yaqui | 0.0 /100 | #289 | Tragic 6.2% |
| Immigrants | Congo | 0.0 /100 | #290 | Tragic 6.2% |
| Whites/Caucasians | 0.0 /100 | #291 | Tragic 6.2% |
| Immigrants | Senegal | 0.0 /100 | #292 | Tragic 6.2% |
Demographics Similar to Chippewa by Disability Age 5 to 17
In terms of disability age 5 to 17, the demographic groups most similar to Chippewa are Immigrants from Cabo Verde (7.1%, a difference of 0.26%), Cajun (7.2%, a difference of 0.96%), Cape Verdean (7.0%, a difference of 2.2%), Cherokee (6.9%, a difference of 2.7%), and Choctaw (6.9%, a difference of 3.0%).
| Demographics | Rating | Rank | Disability Age 5 to 17 |
| Blacks/African Americans | 0.0 /100 | #333 | Tragic 6.8% |
| Seminole | 0.0 /100 | #334 | Tragic 6.8% |
| Ottawa | 0.0 /100 | #335 | Tragic 6.8% |
| Chickasaw | 0.0 /100 | #336 | Tragic 6.8% |
| Creek | 0.0 /100 | #337 | Tragic 6.9% |
| Iroquois | 0.0 /100 | #338 | Tragic 6.9% |
| Choctaw | 0.0 /100 | #339 | Tragic 6.9% |
| Cherokee | 0.0 /100 | #340 | Tragic 6.9% |
| Cape Verdeans | 0.0 /100 | #341 | Tragic 7.0% |
| Chippewa | 0.0 /100 | #342 | Tragic 7.1% |
| Immigrants | Cabo Verde | 0.0 /100 | #343 | Tragic 7.1% |
| Cajuns | 0.0 /100 | #344 | Tragic 7.2% |
| Tsimshian | 0.0 /100 | #345 | Tragic 7.9% |
| Puerto Ricans | 0.0 /100 | #346 | Tragic 8.3% |
| Houma | 0.0 /100 | #347 | Tragic 9.1% |