Immigrants from Brazil vs Chippewa Disability Age 5 to 17
COMPARE
Immigrants from Brazil
Chippewa
Disability Age 5 to 17
Disability Age 5 to 17 Comparison
Immigrants from Brazil
Chippewa
5.8%
DISABILITY AGE 5 TO 17
3.2/ 100
METRIC RATING
236th/ 347
METRIC RANK
7.1%
DISABILITY AGE 5 TO 17
0.0/ 100
METRIC RATING
342nd/ 347
METRIC RANK
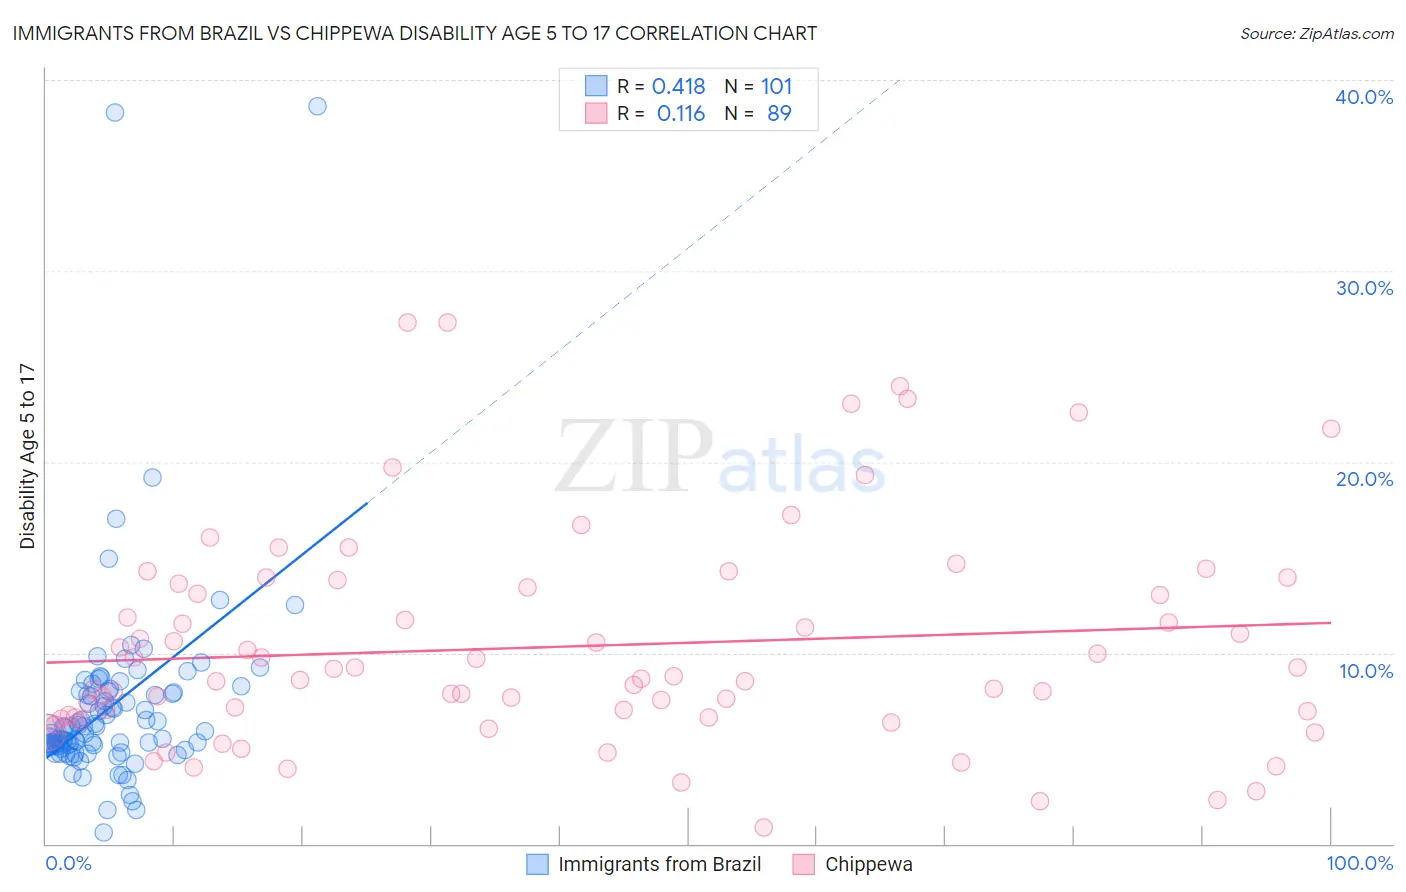
Immigrants from Brazil vs Chippewa Disability Age 5 to 17 Correlation Chart
The statistical analysis conducted on geographies consisting of 340,728,736 people shows a moderate positive correlation between the proportion of Immigrants from Brazil and percentage of population with a disability between the ages 5 and 17 in the United States with a correlation coefficient (R) of 0.418 and weighted average of 5.8%. Similarly, the statistical analysis conducted on geographies consisting of 213,779,900 people shows a poor positive correlation between the proportion of Chippewa and percentage of population with a disability between the ages 5 and 17 in the United States with a correlation coefficient (R) of 0.116 and weighted average of 7.1%, a difference of 22.0%.
Disability Age 5 to 17 Correlation Summary
| Measurement | Immigrants from Brazil | Chippewa |
| Minimum | 0.57% | 0.82% |
| Maximum | 38.7% | 27.3% |
| Range | 38.1% | 26.5% |
| Mean | 7.2% | 10.3% |
| Median | 6.0% | 8.6% |
| Interquartile 25% (IQ1) | 5.1% | 6.6% |
| Interquartile 75% (IQ3) | 8.0% | 13.5% |
| Interquartile Range (IQR) | 2.8% | 6.9% |
| Standard Deviation (Sample) | 5.3% | 5.7% |
| Standard Deviation (Population) | 5.3% | 5.6% |
Similar Demographics by Disability Age 5 to 17
Demographics Similar to Immigrants from Brazil by Disability Age 5 to 17
In terms of disability age 5 to 17, the demographic groups most similar to Immigrants from Brazil are Malaysian (5.8%, a difference of 0.060%), Immigrants from Kenya (5.8%, a difference of 0.070%), Immigrants from West Indies (5.8%, a difference of 0.11%), Sudanese (5.8%, a difference of 0.15%), and Immigrants from Laos (5.8%, a difference of 0.20%).
| Demographics | Rating | Rank | Disability Age 5 to 17 |
| Bangladeshis | 4.8 /100 | #229 | Tragic 5.8% |
| Ghanaians | 4.7 /100 | #230 | Tragic 5.8% |
| Europeans | 4.5 /100 | #231 | Tragic 5.8% |
| Immigrants | Laos | 3.8 /100 | #232 | Tragic 5.8% |
| Immigrants | West Indies | 3.5 /100 | #233 | Tragic 5.8% |
| Immigrants | Kenya | 3.4 /100 | #234 | Tragic 5.8% |
| Malaysians | 3.4 /100 | #235 | Tragic 5.8% |
| Immigrants | Brazil | 3.2 /100 | #236 | Tragic 5.8% |
| Sudanese | 2.9 /100 | #237 | Tragic 5.8% |
| Hungarians | 2.6 /100 | #238 | Tragic 5.8% |
| German Russians | 2.4 /100 | #239 | Tragic 5.9% |
| West Indians | 2.4 /100 | #240 | Tragic 5.9% |
| Immigrants | Caribbean | 2.1 /100 | #241 | Tragic 5.9% |
| Spaniards | 2.0 /100 | #242 | Tragic 5.9% |
| Indonesians | 2.0 /100 | #243 | Tragic 5.9% |
Demographics Similar to Chippewa by Disability Age 5 to 17
In terms of disability age 5 to 17, the demographic groups most similar to Chippewa are Immigrants from Cabo Verde (7.1%, a difference of 0.26%), Cajun (7.2%, a difference of 0.96%), Cape Verdean (7.0%, a difference of 2.2%), Cherokee (6.9%, a difference of 2.7%), and Choctaw (6.9%, a difference of 3.0%).
| Demographics | Rating | Rank | Disability Age 5 to 17 |
| Blacks/African Americans | 0.0 /100 | #333 | Tragic 6.8% |
| Seminole | 0.0 /100 | #334 | Tragic 6.8% |
| Ottawa | 0.0 /100 | #335 | Tragic 6.8% |
| Chickasaw | 0.0 /100 | #336 | Tragic 6.8% |
| Creek | 0.0 /100 | #337 | Tragic 6.9% |
| Iroquois | 0.0 /100 | #338 | Tragic 6.9% |
| Choctaw | 0.0 /100 | #339 | Tragic 6.9% |
| Cherokee | 0.0 /100 | #340 | Tragic 6.9% |
| Cape Verdeans | 0.0 /100 | #341 | Tragic 7.0% |
| Chippewa | 0.0 /100 | #342 | Tragic 7.1% |
| Immigrants | Cabo Verde | 0.0 /100 | #343 | Tragic 7.1% |
| Cajuns | 0.0 /100 | #344 | Tragic 7.2% |
| Tsimshian | 0.0 /100 | #345 | Tragic 7.9% |
| Puerto Ricans | 0.0 /100 | #346 | Tragic 8.3% |
| Houma | 0.0 /100 | #347 | Tragic 9.1% |