Immigrants from Bolivia vs Tsimshian Female Disability
COMPARE
Immigrants from Bolivia
Tsimshian
Female Disability
Female Disability Comparison
Immigrants from Bolivia
Tsimshian
10.3%
FEMALE DISABILITY
100.0/ 100
METRIC RATING
5th/ 347
METRIC RANK
16.8%
FEMALE DISABILITY
0.0/ 100
METRIC RATING
346th/ 347
METRIC RANK
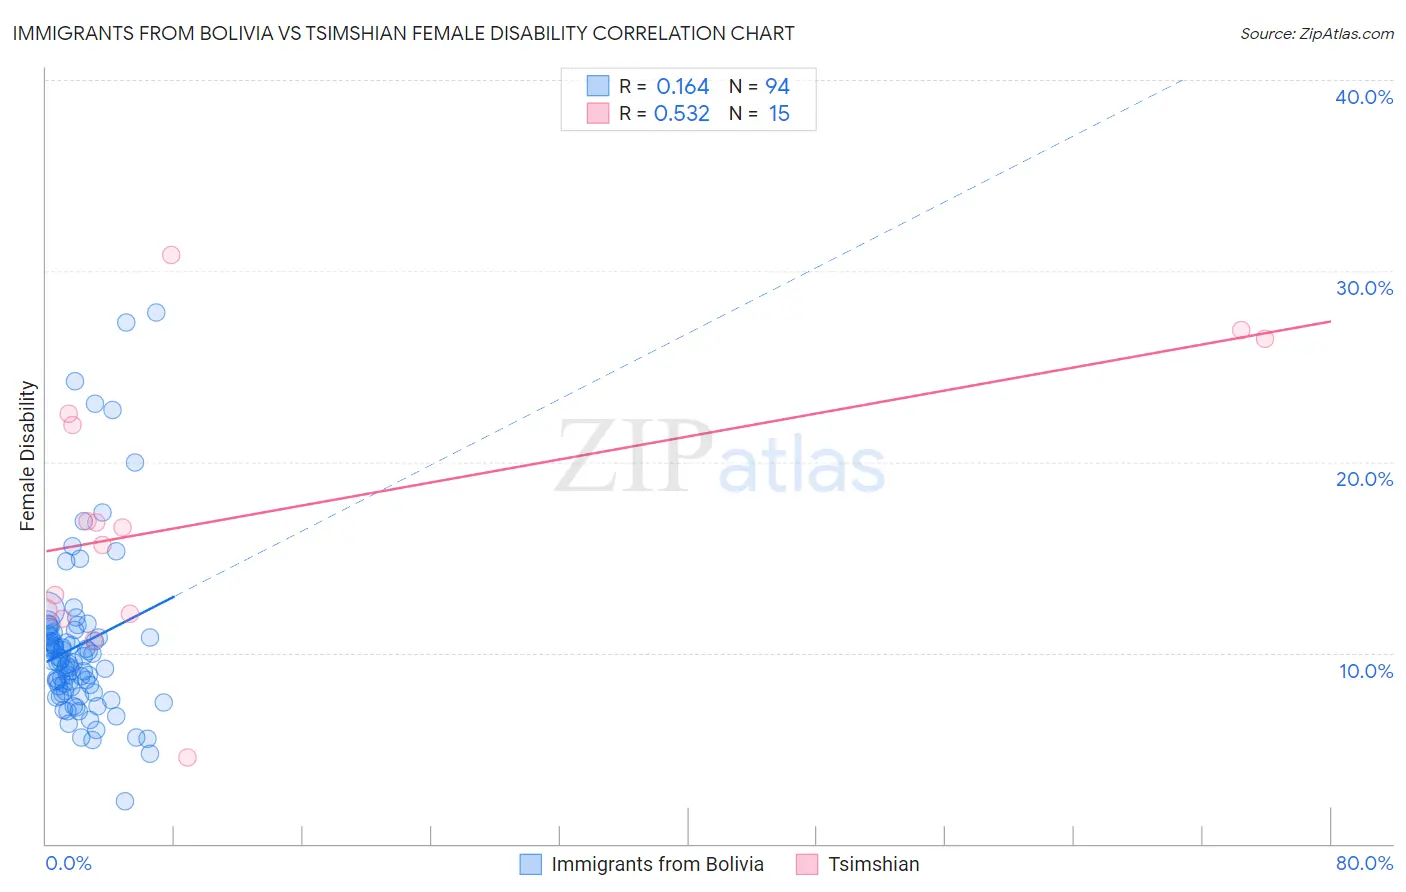
Immigrants from Bolivia vs Tsimshian Female Disability Correlation Chart
The statistical analysis conducted on geographies consisting of 158,717,377 people shows a poor positive correlation between the proportion of Immigrants from Bolivia and percentage of females with a disability in the United States with a correlation coefficient (R) of 0.164 and weighted average of 10.3%. Similarly, the statistical analysis conducted on geographies consisting of 15,626,462 people shows a substantial positive correlation between the proportion of Tsimshian and percentage of females with a disability in the United States with a correlation coefficient (R) of 0.532 and weighted average of 16.8%, a difference of 63.5%.
Female Disability Correlation Summary
| Measurement | Immigrants from Bolivia | Tsimshian |
| Minimum | 2.3% | 4.5% |
| Maximum | 27.8% | 30.9% |
| Range | 25.5% | 26.4% |
| Mean | 10.4% | 17.3% |
| Median | 9.5% | 16.6% |
| Interquartile 25% (IQ1) | 8.0% | 12.0% |
| Interquartile 75% (IQ3) | 10.9% | 22.5% |
| Interquartile Range (IQR) | 2.9% | 10.5% |
| Standard Deviation (Sample) | 4.4% | 7.2% |
| Standard Deviation (Population) | 4.4% | 6.9% |
Similar Demographics by Female Disability
Demographics Similar to Immigrants from Bolivia by Female Disability
In terms of female disability, the demographic groups most similar to Immigrants from Bolivia are Thai (10.2%, a difference of 0.82%), Bolivian (10.4%, a difference of 0.91%), Immigrants from Singapore (10.4%, a difference of 1.7%), Immigrants from Taiwan (10.1%, a difference of 1.7%), and Immigrants from South Central Asia (10.5%, a difference of 1.9%).
| Demographics | Rating | Rank | Female Disability |
| Immigrants | India | 100.0 /100 | #1 | Exceptional 10.0% |
| Filipinos | 100.0 /100 | #2 | Exceptional 10.1% |
| Immigrants | Taiwan | 100.0 /100 | #3 | Exceptional 10.1% |
| Thais | 100.0 /100 | #4 | Exceptional 10.2% |
| Immigrants | Bolivia | 100.0 /100 | #5 | Exceptional 10.3% |
| Bolivians | 100.0 /100 | #6 | Exceptional 10.4% |
| Immigrants | Singapore | 100.0 /100 | #7 | Exceptional 10.4% |
| Immigrants | South Central Asia | 100.0 /100 | #8 | Exceptional 10.5% |
| Iranians | 100.0 /100 | #9 | Exceptional 10.6% |
| Immigrants | Hong Kong | 100.0 /100 | #10 | Exceptional 10.6% |
| Immigrants | Korea | 100.0 /100 | #11 | Exceptional 10.6% |
| Immigrants | Israel | 100.0 /100 | #12 | Exceptional 10.7% |
| Immigrants | Eastern Asia | 100.0 /100 | #13 | Exceptional 10.7% |
| Immigrants | China | 100.0 /100 | #14 | Exceptional 10.7% |
| Burmese | 100.0 /100 | #15 | Exceptional 10.7% |
Demographics Similar to Tsimshian by Female Disability
In terms of female disability, the demographic groups most similar to Tsimshian are Houma (16.9%, a difference of 0.77%), Puerto Rican (16.6%, a difference of 0.94%), Kiowa (15.8%, a difference of 6.2%), Lumbee (15.8%, a difference of 6.3%), and Creek (15.7%, a difference of 7.1%).
| Demographics | Rating | Rank | Female Disability |
| Immigrants | Azores | 0.0 /100 | #333 | Tragic 14.9% |
| Cherokee | 0.0 /100 | #334 | Tragic 14.9% |
| Cajuns | 0.0 /100 | #335 | Tragic 14.9% |
| Seminole | 0.0 /100 | #336 | Tragic 15.0% |
| Tohono O'odham | 0.0 /100 | #337 | Tragic 15.0% |
| Dutch West Indians | 0.0 /100 | #338 | Tragic 15.0% |
| Colville | 0.0 /100 | #339 | Tragic 15.1% |
| Chickasaw | 0.0 /100 | #340 | Tragic 15.2% |
| Choctaw | 0.0 /100 | #341 | Tragic 15.4% |
| Creek | 0.0 /100 | #342 | Tragic 15.7% |
| Lumbee | 0.0 /100 | #343 | Tragic 15.8% |
| Kiowa | 0.0 /100 | #344 | Tragic 15.8% |
| Puerto Ricans | 0.0 /100 | #345 | Tragic 16.6% |
| Tsimshian | 0.0 /100 | #346 | Tragic 16.8% |
| Houma | 0.0 /100 | #347 | Tragic 16.9% |