Delaware vs Tsimshian Female Disability
COMPARE
Delaware
Tsimshian
Female Disability
Female Disability Comparison
Delaware
Tsimshian
13.8%
FEMALE DISABILITY
0.0/ 100
METRIC RATING
312th/ 347
METRIC RANK
16.8%
FEMALE DISABILITY
0.0/ 100
METRIC RATING
346th/ 347
METRIC RANK
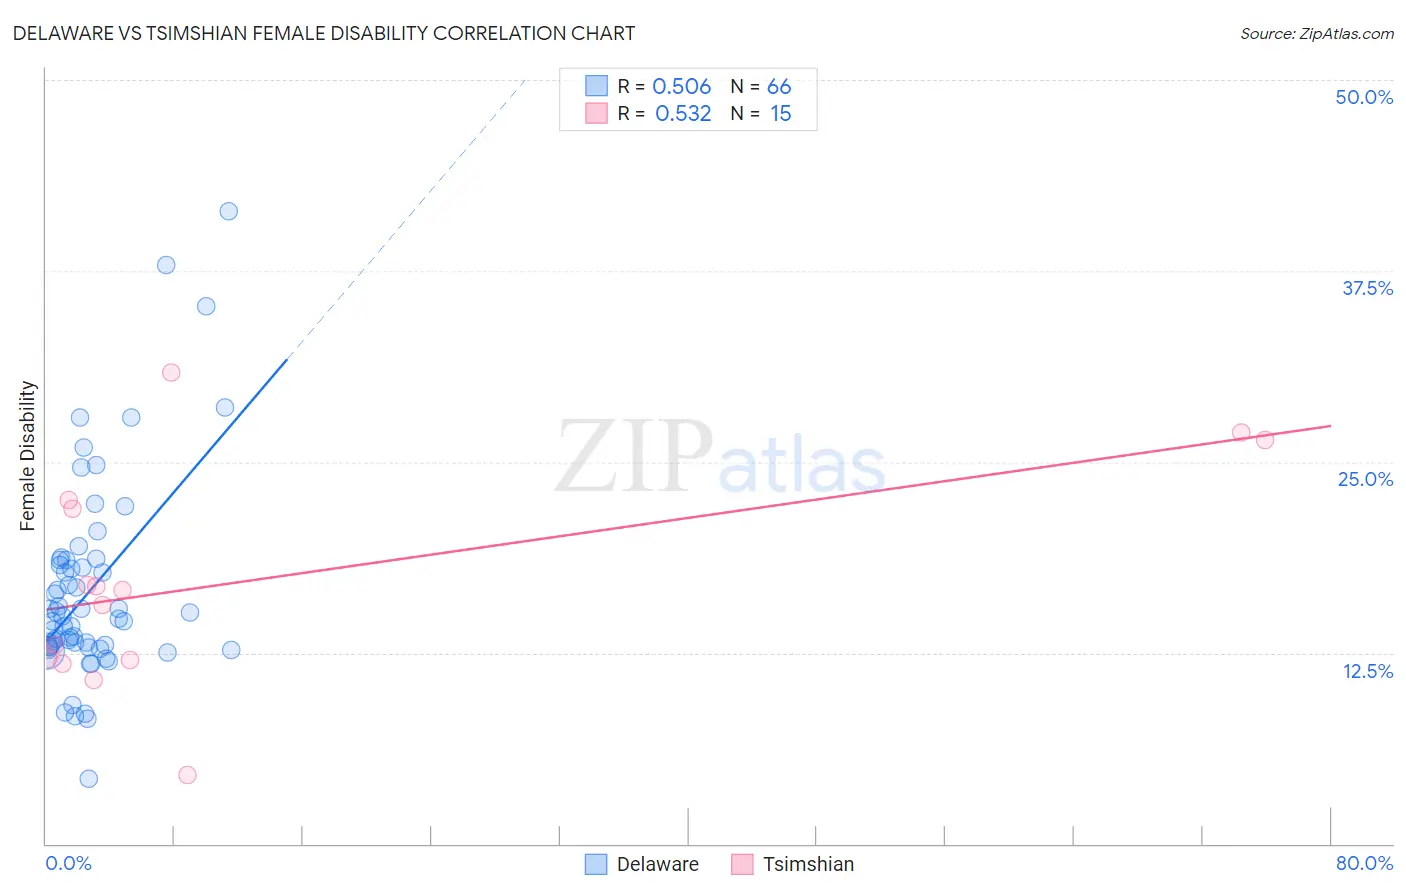
Delaware vs Tsimshian Female Disability Correlation Chart
The statistical analysis conducted on geographies consisting of 96,239,773 people shows a substantial positive correlation between the proportion of Delaware and percentage of females with a disability in the United States with a correlation coefficient (R) of 0.506 and weighted average of 13.8%. Similarly, the statistical analysis conducted on geographies consisting of 15,626,462 people shows a substantial positive correlation between the proportion of Tsimshian and percentage of females with a disability in the United States with a correlation coefficient (R) of 0.532 and weighted average of 16.8%, a difference of 21.6%.
Female Disability Correlation Summary
| Measurement | Delaware | Tsimshian |
| Minimum | 4.2% | 4.5% |
| Maximum | 41.4% | 30.9% |
| Range | 37.2% | 26.4% |
| Mean | 16.6% | 17.3% |
| Median | 14.8% | 16.6% |
| Interquartile 25% (IQ1) | 12.8% | 12.0% |
| Interquartile 75% (IQ3) | 18.5% | 22.5% |
| Interquartile Range (IQR) | 5.7% | 10.5% |
| Standard Deviation (Sample) | 6.8% | 7.2% |
| Standard Deviation (Population) | 6.7% | 6.9% |
Similar Demographics by Female Disability
Demographics Similar to Delaware by Female Disability
In terms of female disability, the demographic groups most similar to Delaware are Hopi (13.7%, a difference of 0.31%), Blackfeet (13.8%, a difference of 0.32%), Puget Sound Salish (13.8%, a difference of 0.42%), Apache (13.7%, a difference of 0.60%), and French American Indian (13.7%, a difference of 0.72%).
| Demographics | Rating | Rank | Female Disability |
| Dominicans | 0.0 /100 | #305 | Tragic 13.5% |
| French Canadians | 0.0 /100 | #306 | Tragic 13.6% |
| Central American Indians | 0.0 /100 | #307 | Tragic 13.6% |
| Cree | 0.0 /100 | #308 | Tragic 13.7% |
| French American Indians | 0.0 /100 | #309 | Tragic 13.7% |
| Apache | 0.0 /100 | #310 | Tragic 13.7% |
| Hopi | 0.0 /100 | #311 | Tragic 13.7% |
| Delaware | 0.0 /100 | #312 | Tragic 13.8% |
| Blackfeet | 0.0 /100 | #313 | Tragic 13.8% |
| Puget Sound Salish | 0.0 /100 | #314 | Tragic 13.8% |
| Alaskan Athabascans | 0.0 /100 | #315 | Tragic 13.9% |
| Spanish Americans | 0.0 /100 | #316 | Tragic 14.0% |
| Chippewa | 0.0 /100 | #317 | Tragic 14.0% |
| Paiute | 0.0 /100 | #318 | Tragic 14.0% |
| Iroquois | 0.0 /100 | #319 | Tragic 14.0% |
Demographics Similar to Tsimshian by Female Disability
In terms of female disability, the demographic groups most similar to Tsimshian are Houma (16.9%, a difference of 0.77%), Puerto Rican (16.6%, a difference of 0.94%), Kiowa (15.8%, a difference of 6.2%), Lumbee (15.8%, a difference of 6.3%), and Creek (15.7%, a difference of 7.1%).
| Demographics | Rating | Rank | Female Disability |
| Immigrants | Azores | 0.0 /100 | #333 | Tragic 14.9% |
| Cherokee | 0.0 /100 | #334 | Tragic 14.9% |
| Cajuns | 0.0 /100 | #335 | Tragic 14.9% |
| Seminole | 0.0 /100 | #336 | Tragic 15.0% |
| Tohono O'odham | 0.0 /100 | #337 | Tragic 15.0% |
| Dutch West Indians | 0.0 /100 | #338 | Tragic 15.0% |
| Colville | 0.0 /100 | #339 | Tragic 15.1% |
| Chickasaw | 0.0 /100 | #340 | Tragic 15.2% |
| Choctaw | 0.0 /100 | #341 | Tragic 15.4% |
| Creek | 0.0 /100 | #342 | Tragic 15.7% |
| Lumbee | 0.0 /100 | #343 | Tragic 15.8% |
| Kiowa | 0.0 /100 | #344 | Tragic 15.8% |
| Puerto Ricans | 0.0 /100 | #345 | Tragic 16.6% |
| Tsimshian | 0.0 /100 | #346 | Tragic 16.8% |
| Houma | 0.0 /100 | #347 | Tragic 16.9% |