Ecuadorian vs Immigrants from the Azores Male Disability
COMPARE
Ecuadorian
Immigrants from the Azores
Male Disability
Male Disability Comparison
Ecuadorians
Immigrants from the Azores
10.5%
MALE DISABILITY
99.2/ 100
METRIC RATING
69th/ 347
METRIC RANK
13.4%
MALE DISABILITY
0.0/ 100
METRIC RATING
310th/ 347
METRIC RANK
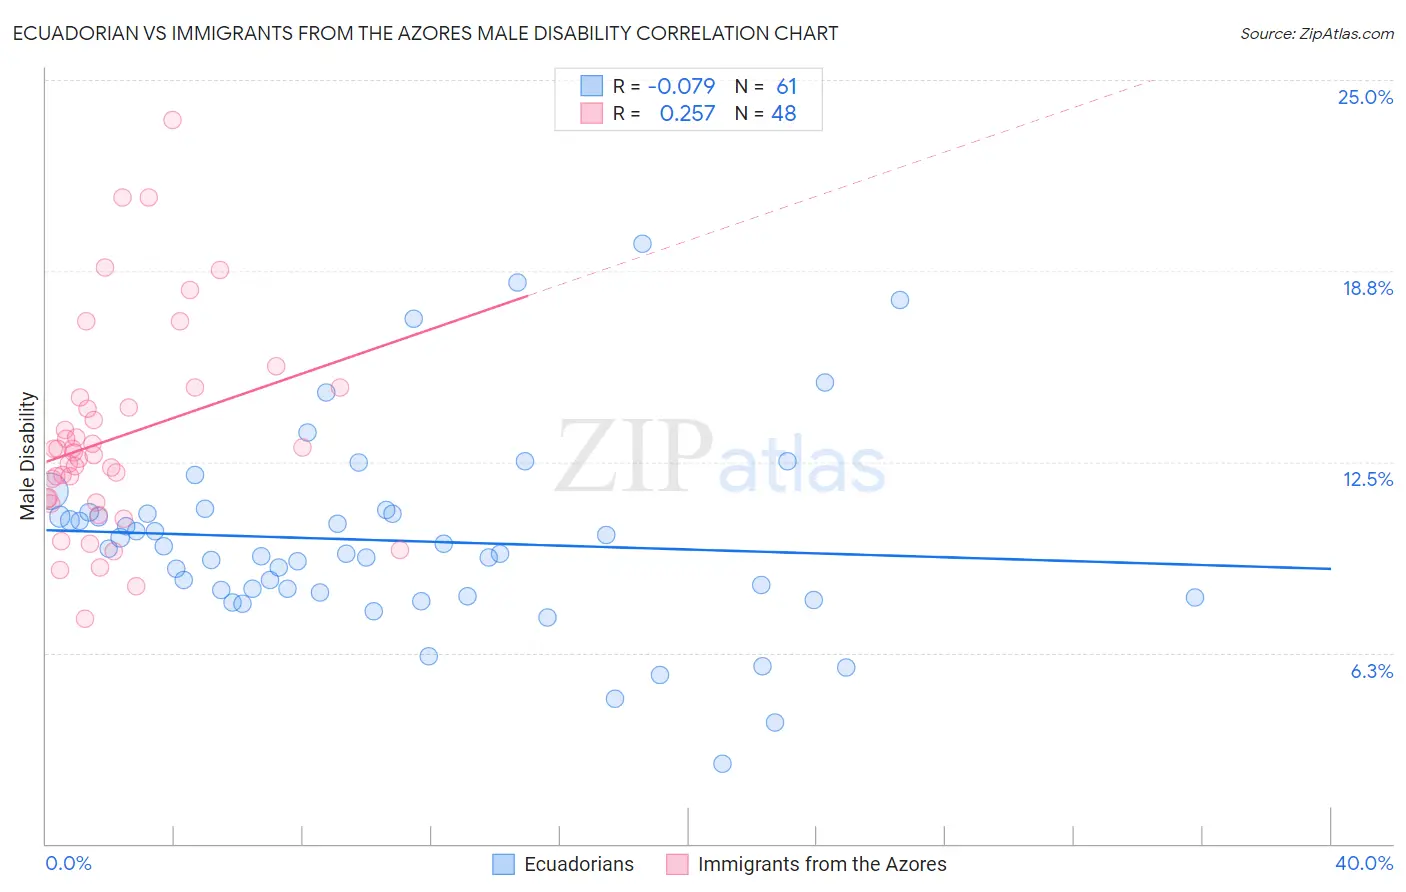
Ecuadorian vs Immigrants from the Azores Male Disability Correlation Chart
The statistical analysis conducted on geographies consisting of 317,801,764 people shows a slight negative correlation between the proportion of Ecuadorians and percentage of males with a disability in the United States with a correlation coefficient (R) of -0.079 and weighted average of 10.5%. Similarly, the statistical analysis conducted on geographies consisting of 46,257,178 people shows a weak positive correlation between the proportion of Immigrants from the Azores and percentage of males with a disability in the United States with a correlation coefficient (R) of 0.257 and weighted average of 13.4%, a difference of 28.3%.
Male Disability Correlation Summary
| Measurement | Ecuadorian | Immigrants from the Azores |
| Minimum | 2.6% | 7.4% |
| Maximum | 19.6% | 23.7% |
| Range | 17.0% | 16.3% |
| Mean | 9.9% | 13.3% |
| Median | 9.5% | 12.8% |
| Interquartile 25% (IQ1) | 8.2% | 11.2% |
| Interquartile 75% (IQ3) | 10.8% | 14.4% |
| Interquartile Range (IQR) | 2.7% | 3.2% |
| Standard Deviation (Sample) | 3.2% | 3.4% |
| Standard Deviation (Population) | 3.2% | 3.4% |
Similar Demographics by Male Disability
Demographics Similar to Ecuadorians by Male Disability
In terms of male disability, the demographic groups most similar to Ecuadorians are Colombian (10.5%, a difference of 0.0%), Immigrants from Afghanistan (10.5%, a difference of 0.10%), Immigrants from Grenada (10.5%, a difference of 0.11%), Guyanese (10.5%, a difference of 0.11%), and Jordanian (10.5%, a difference of 0.13%).
| Demographics | Rating | Rank | Male Disability |
| Immigrants | Ecuador | 99.3 /100 | #62 | Exceptional 10.4% |
| Immigrants | Belarus | 99.3 /100 | #63 | Exceptional 10.4% |
| Jordanians | 99.3 /100 | #64 | Exceptional 10.5% |
| Immigrants | Grenada | 99.2 /100 | #65 | Exceptional 10.5% |
| Guyanese | 99.2 /100 | #66 | Exceptional 10.5% |
| Immigrants | Afghanistan | 99.2 /100 | #67 | Exceptional 10.5% |
| Colombians | 99.2 /100 | #68 | Exceptional 10.5% |
| Ecuadorians | 99.2 /100 | #69 | Exceptional 10.5% |
| Immigrants | Bulgaria | 99.1 /100 | #70 | Exceptional 10.5% |
| Immigrants | Cameroon | 99.0 /100 | #71 | Exceptional 10.5% |
| Immigrants | Serbia | 99.0 /100 | #72 | Exceptional 10.5% |
| Immigrants | Lithuania | 98.9 /100 | #73 | Exceptional 10.5% |
| Immigrants | Lebanon | 98.8 /100 | #74 | Exceptional 10.5% |
| Sierra Leoneans | 98.7 /100 | #75 | Exceptional 10.5% |
| Immigrants | Sierra Leone | 98.7 /100 | #76 | Exceptional 10.5% |
Demographics Similar to Immigrants from the Azores by Male Disability
In terms of male disability, the demographic groups most similar to Immigrants from the Azores are Blackfeet (13.4%, a difference of 0.14%), Delaware (13.5%, a difference of 0.19%), French American Indian (13.4%, a difference of 0.56%), Arapaho (13.3%, a difference of 0.72%), and Yakama (13.5%, a difference of 0.74%).
| Demographics | Rating | Rank | Male Disability |
| Scotch-Irish | 0.0 /100 | #303 | Tragic 13.2% |
| Blacks/African Americans | 0.0 /100 | #304 | Tragic 13.2% |
| French Canadians | 0.0 /100 | #305 | Tragic 13.3% |
| Spanish Americans | 0.0 /100 | #306 | Tragic 13.3% |
| Arapaho | 0.0 /100 | #307 | Tragic 13.3% |
| French American Indians | 0.0 /100 | #308 | Tragic 13.4% |
| Blackfeet | 0.0 /100 | #309 | Tragic 13.4% |
| Immigrants | Azores | 0.0 /100 | #310 | Tragic 13.4% |
| Delaware | 0.0 /100 | #311 | Tragic 13.5% |
| Yakama | 0.0 /100 | #312 | Tragic 13.5% |
| Puget Sound Salish | 0.0 /100 | #313 | Tragic 13.5% |
| Aleuts | 0.0 /100 | #314 | Tragic 13.5% |
| Iroquois | 0.0 /100 | #315 | Tragic 13.6% |
| Alaska Natives | 0.0 /100 | #316 | Tragic 13.6% |
| Paiute | 0.0 /100 | #317 | Tragic 13.7% |