Immigrants from Honduras vs Immigrants from Burma/Myanmar Female Disability
COMPARE
Immigrants from Honduras
Immigrants from Burma/Myanmar
Female Disability
Female Disability Comparison
Immigrants from Honduras
Immigrants from Burma/Myanmar
12.3%
FEMALE DISABILITY
31.3/ 100
METRIC RATING
190th/ 347
METRIC RANK
12.4%
FEMALE DISABILITY
13.3/ 100
METRIC RATING
216th/ 347
METRIC RANK
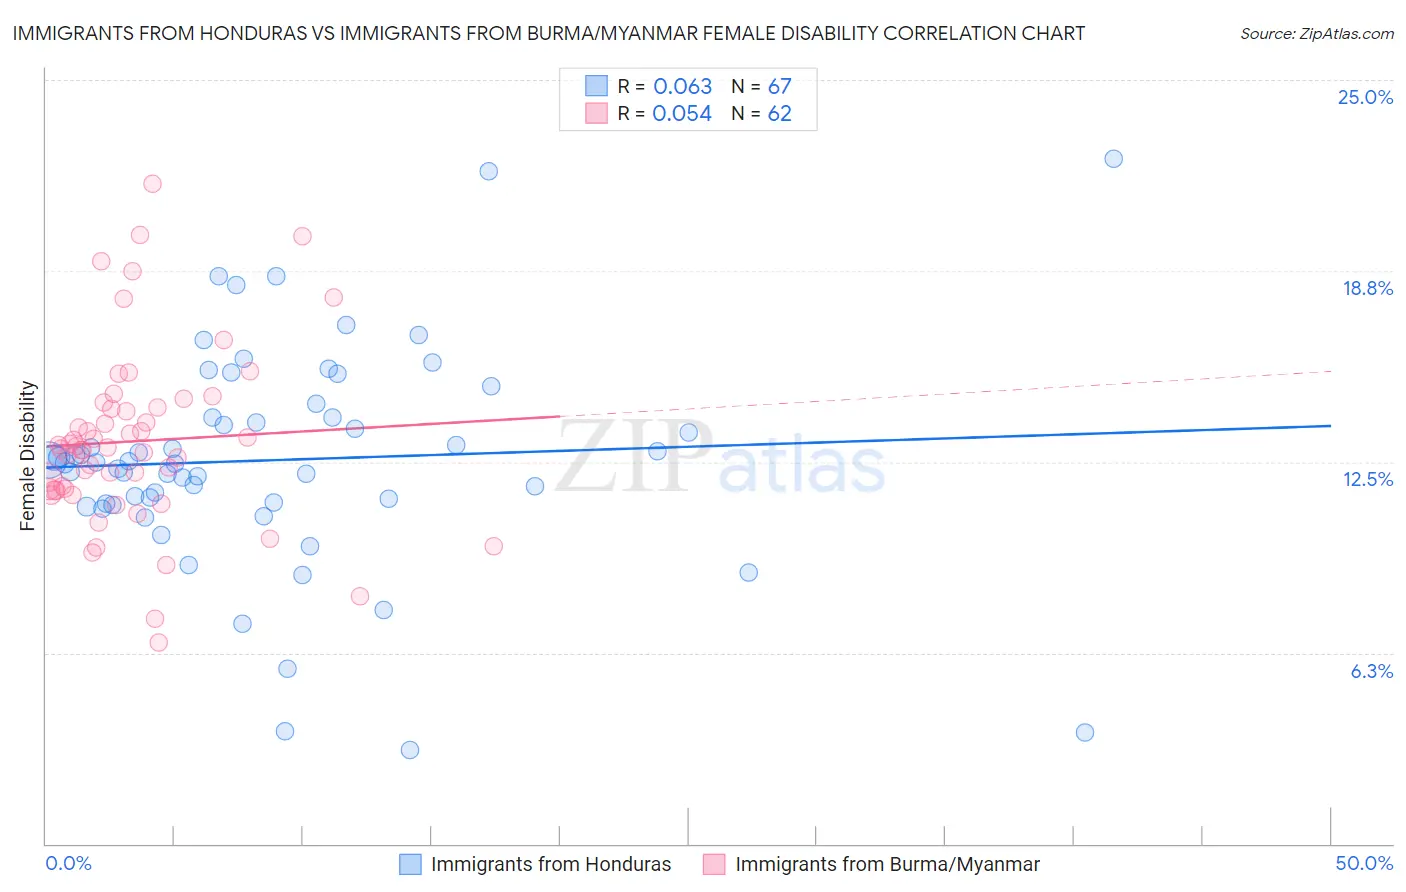
Immigrants from Honduras vs Immigrants from Burma/Myanmar Female Disability Correlation Chart
The statistical analysis conducted on geographies consisting of 322,542,549 people shows a slight positive correlation between the proportion of Immigrants from Honduras and percentage of females with a disability in the United States with a correlation coefficient (R) of 0.063 and weighted average of 12.3%. Similarly, the statistical analysis conducted on geographies consisting of 172,344,349 people shows a slight positive correlation between the proportion of Immigrants from Burma/Myanmar and percentage of females with a disability in the United States with a correlation coefficient (R) of 0.054 and weighted average of 12.4%, a difference of 1.0%.
Female Disability Correlation Summary
| Measurement | Immigrants from Honduras | Immigrants from Burma/Myanmar |
| Minimum | 3.1% | 6.6% |
| Maximum | 22.4% | 21.6% |
| Range | 19.4% | 15.0% |
| Mean | 12.6% | 13.2% |
| Median | 12.5% | 12.9% |
| Interquartile 25% (IQ1) | 11.1% | 11.6% |
| Interquartile 75% (IQ3) | 14.0% | 14.3% |
| Interquartile Range (IQR) | 2.8% | 2.7% |
| Standard Deviation (Sample) | 3.6% | 2.9% |
| Standard Deviation (Population) | 3.6% | 2.9% |
Similar Demographics by Female Disability
Demographics Similar to Immigrants from Honduras by Female Disability
In terms of female disability, the demographic groups most similar to Immigrants from Honduras are Immigrants from Albania (12.3%, a difference of 0.010%), Immigrants from North America (12.3%, a difference of 0.060%), Armenian (12.3%, a difference of 0.070%), Serbian (12.3%, a difference of 0.080%), and Austrian (12.3%, a difference of 0.090%).
| Demographics | Rating | Rank | Female Disability |
| Cubans | 36.5 /100 | #183 | Fair 12.3% |
| Iraqis | 36.0 /100 | #184 | Fair 12.3% |
| Immigrants | Uzbekistan | 33.9 /100 | #185 | Fair 12.3% |
| Austrians | 33.3 /100 | #186 | Fair 12.3% |
| Serbians | 33.1 /100 | #187 | Fair 12.3% |
| Immigrants | North America | 32.8 /100 | #188 | Fair 12.3% |
| Immigrants | Albania | 31.6 /100 | #189 | Fair 12.3% |
| Immigrants | Honduras | 31.3 /100 | #190 | Fair 12.3% |
| Armenians | 29.7 /100 | #191 | Fair 12.3% |
| Immigrants | Western Africa | 29.2 /100 | #192 | Fair 12.3% |
| Northern Europeans | 27.5 /100 | #193 | Fair 12.3% |
| Ukrainians | 27.2 /100 | #194 | Fair 12.3% |
| Swedes | 26.6 /100 | #195 | Fair 12.3% |
| Immigrants | Panama | 25.5 /100 | #196 | Fair 12.3% |
| Hondurans | 25.4 /100 | #197 | Fair 12.3% |
Demographics Similar to Immigrants from Burma/Myanmar by Female Disability
In terms of female disability, the demographic groups most similar to Immigrants from Burma/Myanmar are Panamanian (12.4%, a difference of 0.010%), Samoan (12.4%, a difference of 0.010%), British (12.4%, a difference of 0.050%), Immigrants from Bahamas (12.4%, a difference of 0.070%), and Immigrants from Thailand (12.4%, a difference of 0.090%).
| Demographics | Rating | Rank | Female Disability |
| Mexicans | 15.7 /100 | #209 | Poor 12.4% |
| Swiss | 14.9 /100 | #210 | Poor 12.4% |
| Immigrants | Bosnia and Herzegovina | 14.8 /100 | #211 | Poor 12.4% |
| Ute | 14.7 /100 | #212 | Poor 12.4% |
| Immigrants | Thailand | 14.5 /100 | #213 | Poor 12.4% |
| Panamanians | 13.5 /100 | #214 | Poor 12.4% |
| Samoans | 13.4 /100 | #215 | Poor 12.4% |
| Immigrants | Burma/Myanmar | 13.3 /100 | #216 | Poor 12.4% |
| British | 12.7 /100 | #217 | Poor 12.4% |
| Immigrants | Bahamas | 12.5 /100 | #218 | Poor 12.4% |
| Europeans | 12.1 /100 | #219 | Poor 12.4% |
| Bahamians | 11.1 /100 | #220 | Poor 12.4% |
| Native Hawaiians | 10.8 /100 | #221 | Poor 12.4% |
| Italians | 10.7 /100 | #222 | Poor 12.4% |
| Guamanians/Chamorros | 9.5 /100 | #223 | Tragic 12.5% |