Sierra Leonean vs Immigrants from Burma/Myanmar Female Disability
COMPARE
Sierra Leonean
Immigrants from Burma/Myanmar
Female Disability
Female Disability Comparison
Sierra Leoneans
Immigrants from Burma/Myanmar
11.5%
FEMALE DISABILITY
99.7/ 100
METRIC RATING
79th/ 347
METRIC RANK
12.4%
FEMALE DISABILITY
13.3/ 100
METRIC RATING
216th/ 347
METRIC RANK
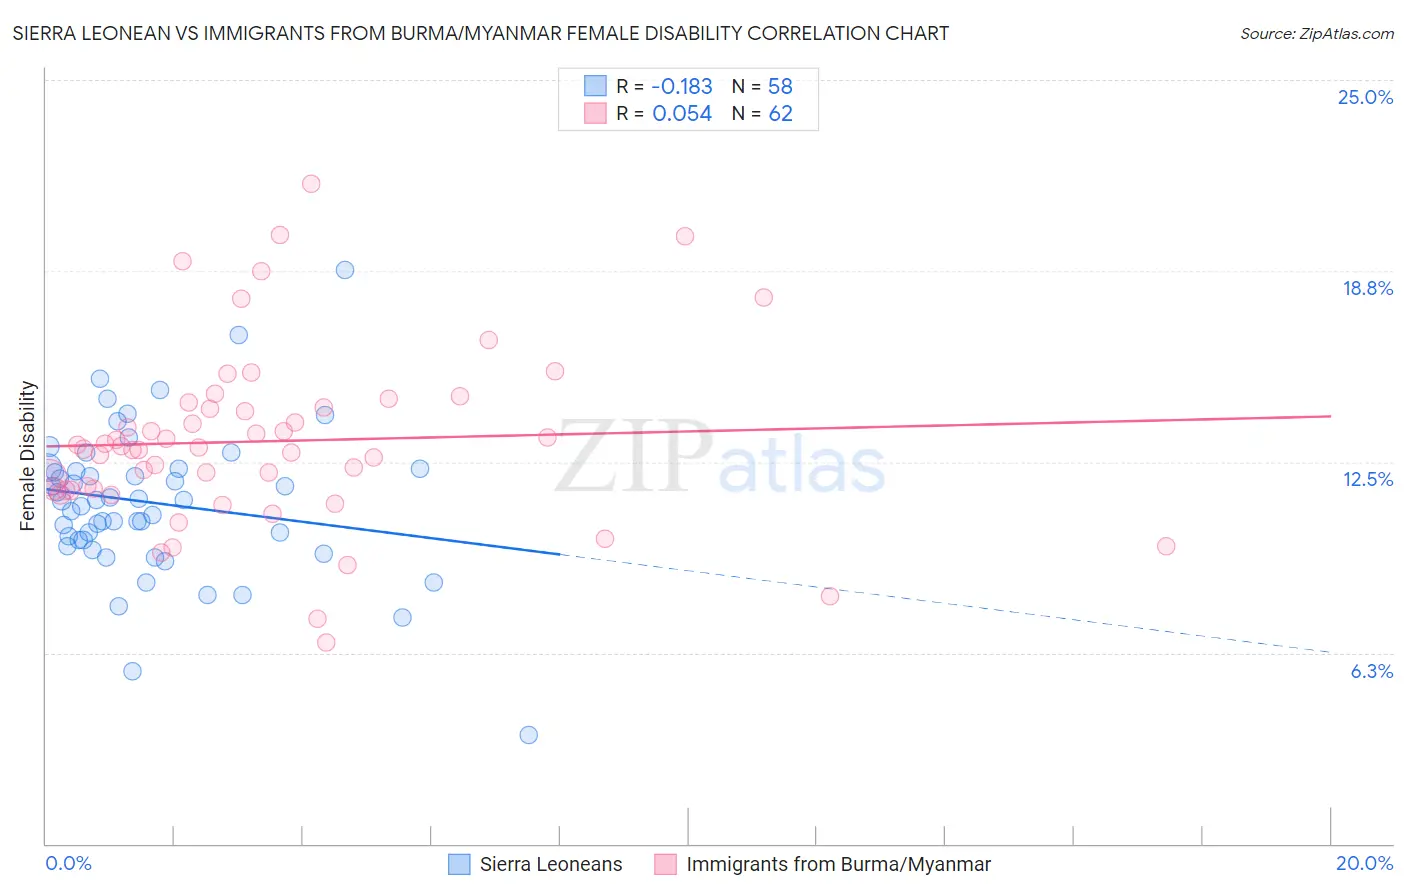
Sierra Leonean vs Immigrants from Burma/Myanmar Female Disability Correlation Chart
The statistical analysis conducted on geographies consisting of 83,353,853 people shows a poor negative correlation between the proportion of Sierra Leoneans and percentage of females with a disability in the United States with a correlation coefficient (R) of -0.183 and weighted average of 11.5%. Similarly, the statistical analysis conducted on geographies consisting of 172,344,349 people shows a slight positive correlation between the proportion of Immigrants from Burma/Myanmar and percentage of females with a disability in the United States with a correlation coefficient (R) of 0.054 and weighted average of 12.4%, a difference of 7.7%.
Female Disability Correlation Summary
| Measurement | Sierra Leonean | Immigrants from Burma/Myanmar |
| Minimum | 3.6% | 6.6% |
| Maximum | 18.8% | 21.6% |
| Range | 15.2% | 15.0% |
| Mean | 11.2% | 13.2% |
| Median | 11.2% | 12.9% |
| Interquartile 25% (IQ1) | 9.9% | 11.6% |
| Interquartile 75% (IQ3) | 12.3% | 14.3% |
| Interquartile Range (IQR) | 2.3% | 2.7% |
| Standard Deviation (Sample) | 2.5% | 2.9% |
| Standard Deviation (Population) | 2.4% | 2.9% |
Similar Demographics by Female Disability
Demographics Similar to Sierra Leoneans by Female Disability
In terms of female disability, the demographic groups most similar to Sierra Leoneans are Immigrants from Jordan (11.5%, a difference of 0.010%), Immigrants from South Africa (11.5%, a difference of 0.020%), Immigrants from Eritrea (11.5%, a difference of 0.030%), Immigrants from Afghanistan (11.5%, a difference of 0.030%), and Immigrants from Lebanon (11.5%, a difference of 0.060%).
| Demographics | Rating | Rank | Female Disability |
| Chileans | 99.8 /100 | #72 | Exceptional 11.5% |
| Immigrants | Switzerland | 99.8 /100 | #73 | Exceptional 11.5% |
| Bhutanese | 99.8 /100 | #74 | Exceptional 11.5% |
| Immigrants | Lebanon | 99.7 /100 | #75 | Exceptional 11.5% |
| Immigrants | Eritrea | 99.7 /100 | #76 | Exceptional 11.5% |
| Immigrants | Afghanistan | 99.7 /100 | #77 | Exceptional 11.5% |
| Immigrants | South Africa | 99.7 /100 | #78 | Exceptional 11.5% |
| Sierra Leoneans | 99.7 /100 | #79 | Exceptional 11.5% |
| Immigrants | Jordan | 99.7 /100 | #80 | Exceptional 11.5% |
| Eastern Europeans | 99.7 /100 | #81 | Exceptional 11.5% |
| Luxembourgers | 99.6 /100 | #82 | Exceptional 11.6% |
| Immigrants | Serbia | 99.6 /100 | #83 | Exceptional 11.6% |
| Immigrants | Poland | 99.6 /100 | #84 | Exceptional 11.6% |
| Palestinians | 99.6 /100 | #85 | Exceptional 11.6% |
| Immigrants | Cameroon | 99.6 /100 | #86 | Exceptional 11.6% |
Demographics Similar to Immigrants from Burma/Myanmar by Female Disability
In terms of female disability, the demographic groups most similar to Immigrants from Burma/Myanmar are Panamanian (12.4%, a difference of 0.010%), Samoan (12.4%, a difference of 0.010%), British (12.4%, a difference of 0.050%), Immigrants from Bahamas (12.4%, a difference of 0.070%), and Immigrants from Thailand (12.4%, a difference of 0.090%).
| Demographics | Rating | Rank | Female Disability |
| Mexicans | 15.7 /100 | #209 | Poor 12.4% |
| Swiss | 14.9 /100 | #210 | Poor 12.4% |
| Immigrants | Bosnia and Herzegovina | 14.8 /100 | #211 | Poor 12.4% |
| Ute | 14.7 /100 | #212 | Poor 12.4% |
| Immigrants | Thailand | 14.5 /100 | #213 | Poor 12.4% |
| Panamanians | 13.5 /100 | #214 | Poor 12.4% |
| Samoans | 13.4 /100 | #215 | Poor 12.4% |
| Immigrants | Burma/Myanmar | 13.3 /100 | #216 | Poor 12.4% |
| British | 12.7 /100 | #217 | Poor 12.4% |
| Immigrants | Bahamas | 12.5 /100 | #218 | Poor 12.4% |
| Europeans | 12.1 /100 | #219 | Poor 12.4% |
| Bahamians | 11.1 /100 | #220 | Poor 12.4% |
| Native Hawaiians | 10.8 /100 | #221 | Poor 12.4% |
| Italians | 10.7 /100 | #222 | Poor 12.4% |
| Guamanians/Chamorros | 9.5 /100 | #223 | Tragic 12.5% |