Immigrants from Spain vs Arab Disability Age 5 to 17
COMPARE
Immigrants from Spain
Arab
Disability Age 5 to 17
Disability Age 5 to 17 Comparison
Immigrants from Spain
Arabs
5.2%
DISABILITY AGE 5 TO 17
99.4/ 100
METRIC RATING
89th/ 347
METRIC RANK
5.4%
DISABILITY AGE 5 TO 17
92.9/ 100
METRIC RATING
131st/ 347
METRIC RANK
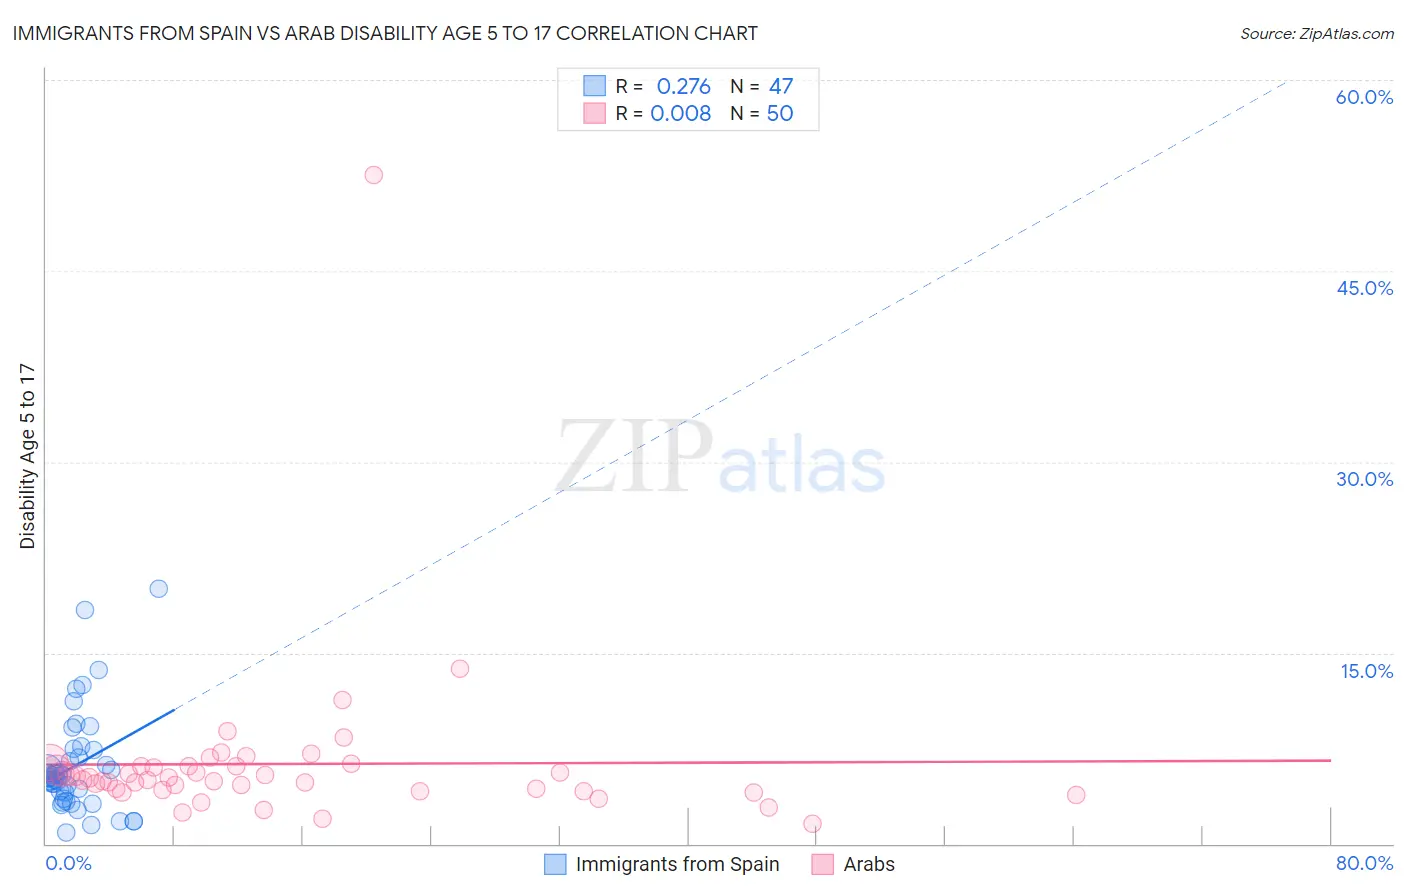
Immigrants from Spain vs Arab Disability Age 5 to 17 Correlation Chart
The statistical analysis conducted on geographies consisting of 238,485,416 people shows a weak positive correlation between the proportion of Immigrants from Spain and percentage of population with a disability between the ages 5 and 17 in the United States with a correlation coefficient (R) of 0.276 and weighted average of 5.2%. Similarly, the statistical analysis conducted on geographies consisting of 481,041,182 people shows no correlation between the proportion of Arabs and percentage of population with a disability between the ages 5 and 17 in the United States with a correlation coefficient (R) of 0.008 and weighted average of 5.4%, a difference of 3.3%.
Disability Age 5 to 17 Correlation Summary
| Measurement | Immigrants from Spain | Arab |
| Minimum | 0.84% | 1.6% |
| Maximum | 20.0% | 52.5% |
| Range | 19.2% | 50.9% |
| Mean | 6.1% | 6.3% |
| Median | 5.3% | 5.1% |
| Interquartile 25% (IQ1) | 3.6% | 4.2% |
| Interquartile 75% (IQ3) | 7.4% | 6.1% |
| Interquartile Range (IQR) | 3.9% | 1.9% |
| Standard Deviation (Sample) | 4.0% | 7.0% |
| Standard Deviation (Population) | 4.0% | 6.9% |
Similar Demographics by Disability Age 5 to 17
Demographics Similar to Immigrants from Spain by Disability Age 5 to 17
In terms of disability age 5 to 17, the demographic groups most similar to Immigrants from Spain are Immigrants from Croatia (5.2%, a difference of 0.0%), Eastern European (5.2%, a difference of 0.030%), Immigrants from Kuwait (5.3%, a difference of 0.050%), Immigrants from St. Vincent and the Grenadines (5.2%, a difference of 0.080%), and Bulgarian (5.2%, a difference of 0.12%).
| Demographics | Rating | Rank | Disability Age 5 to 17 |
| Immigrants | Sweden | 99.5 /100 | #82 | Exceptional 5.2% |
| Immigrants | France | 99.5 /100 | #83 | Exceptional 5.2% |
| Immigrants | Nicaragua | 99.5 /100 | #84 | Exceptional 5.2% |
| Bulgarians | 99.4 /100 | #85 | Exceptional 5.2% |
| Immigrants | St. Vincent and the Grenadines | 99.4 /100 | #86 | Exceptional 5.2% |
| Eastern Europeans | 99.4 /100 | #87 | Exceptional 5.2% |
| Immigrants | Croatia | 99.4 /100 | #88 | Exceptional 5.2% |
| Immigrants | Spain | 99.4 /100 | #89 | Exceptional 5.2% |
| Immigrants | Kuwait | 99.4 /100 | #90 | Exceptional 5.3% |
| Mongolians | 99.2 /100 | #91 | Exceptional 5.3% |
| Luxembourgers | 99.2 /100 | #92 | Exceptional 5.3% |
| Immigrants | Peru | 99.1 /100 | #93 | Exceptional 5.3% |
| Immigrants | Jordan | 99.1 /100 | #94 | Exceptional 5.3% |
| Immigrants | Grenada | 99.1 /100 | #95 | Exceptional 5.3% |
| Immigrants | El Salvador | 99.0 /100 | #96 | Exceptional 5.3% |
Demographics Similar to Arabs by Disability Age 5 to 17
In terms of disability age 5 to 17, the demographic groups most similar to Arabs are Immigrants from Colombia (5.4%, a difference of 0.020%), Venezuelan (5.4%, a difference of 0.050%), Yuman (5.4%, a difference of 0.13%), Immigrants from Belize (5.4%, a difference of 0.22%), and Immigrants from Bulgaria (5.4%, a difference of 0.23%).
| Demographics | Rating | Rank | Disability Age 5 to 17 |
| Crow | 95.0 /100 | #124 | Exceptional 5.4% |
| Immigrants | Chile | 95.0 /100 | #125 | Exceptional 5.4% |
| New Zealanders | 95.0 /100 | #126 | Exceptional 5.4% |
| Latvians | 95.0 /100 | #127 | Exceptional 5.4% |
| Immigrants | Venezuela | 94.5 /100 | #128 | Exceptional 5.4% |
| Romanians | 94.1 /100 | #129 | Exceptional 5.4% |
| Immigrants | Bulgaria | 94.0 /100 | #130 | Exceptional 5.4% |
| Arabs | 92.9 /100 | #131 | Exceptional 5.4% |
| Immigrants | Colombia | 92.9 /100 | #132 | Exceptional 5.4% |
| Venezuelans | 92.7 /100 | #133 | Exceptional 5.4% |
| Yuman | 92.3 /100 | #134 | Exceptional 5.4% |
| Immigrants | Belize | 91.7 /100 | #135 | Exceptional 5.4% |
| Immigrants | Denmark | 91.4 /100 | #136 | Exceptional 5.4% |
| Navajo | 90.9 /100 | #137 | Exceptional 5.4% |
| Immigrants | Oceania | 90.8 /100 | #138 | Exceptional 5.4% |