Bulgarian vs Immigrants from Europe Vision Disability
COMPARE
Bulgarian
Immigrants from Europe
Vision Disability
Vision Disability Comparison
Bulgarians
Immigrants from Europe
1.9%
VISION DISABILITY
99.9/ 100
METRIC RATING
25th/ 347
METRIC RANK
2.1%
VISION DISABILITY
96.1/ 100
METRIC RATING
93rd/ 347
METRIC RANK
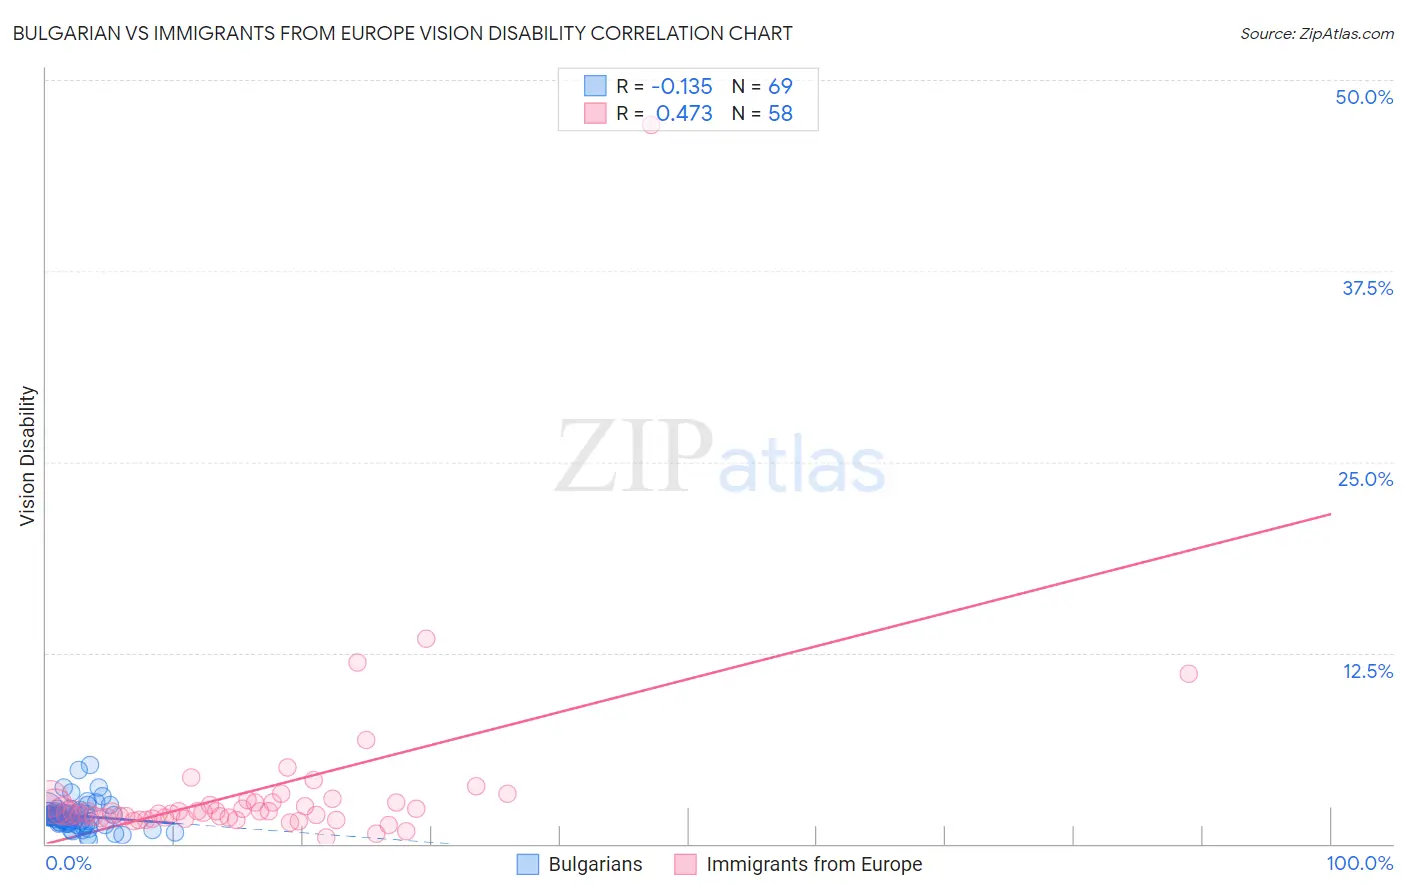
Bulgarian vs Immigrants from Europe Vision Disability Correlation Chart
The statistical analysis conducted on geographies consisting of 205,563,576 people shows a poor negative correlation between the proportion of Bulgarians and percentage of population with vision disability in the United States with a correlation coefficient (R) of -0.135 and weighted average of 1.9%. Similarly, the statistical analysis conducted on geographies consisting of 546,008,895 people shows a moderate positive correlation between the proportion of Immigrants from Europe and percentage of population with vision disability in the United States with a correlation coefficient (R) of 0.473 and weighted average of 2.1%, a difference of 7.1%.
Vision Disability Correlation Summary
| Measurement | Bulgarian | Immigrants from Europe |
| Minimum | 0.26% | 0.41% |
| Maximum | 5.2% | 47.1% |
| Range | 4.9% | 46.7% |
| Mean | 1.8% | 3.5% |
| Median | 1.8% | 2.1% |
| Interquartile 25% (IQ1) | 1.3% | 1.7% |
| Interquartile 75% (IQ3) | 2.0% | 2.7% |
| Interquartile Range (IQR) | 0.69% | 1.0% |
| Standard Deviation (Sample) | 0.87% | 6.3% |
| Standard Deviation (Population) | 0.86% | 6.3% |
Similar Demographics by Vision Disability
Demographics Similar to Bulgarians by Vision Disability
In terms of vision disability, the demographic groups most similar to Bulgarians are Immigrants from Lithuania (1.9%, a difference of 0.040%), Immigrants from Japan (1.9%, a difference of 0.040%), Immigrants from Asia (1.9%, a difference of 0.16%), Taiwanese (1.9%, a difference of 0.37%), and Immigrants from Malaysia (1.9%, a difference of 0.40%).
| Demographics | Rating | Rank | Vision Disability |
| Bolivians | 100.0 /100 | #18 | Exceptional 1.9% |
| Immigrants | Sri Lanka | 100.0 /100 | #19 | Exceptional 1.9% |
| Asians | 100.0 /100 | #20 | Exceptional 1.9% |
| Turks | 100.0 /100 | #21 | Exceptional 1.9% |
| Immigrants | Pakistan | 100.0 /100 | #22 | Exceptional 1.9% |
| Immigrants | Asia | 99.9 /100 | #23 | Exceptional 1.9% |
| Immigrants | Lithuania | 99.9 /100 | #24 | Exceptional 1.9% |
| Bulgarians | 99.9 /100 | #25 | Exceptional 1.9% |
| Immigrants | Japan | 99.9 /100 | #26 | Exceptional 1.9% |
| Taiwanese | 99.9 /100 | #27 | Exceptional 1.9% |
| Immigrants | Malaysia | 99.9 /100 | #28 | Exceptional 1.9% |
| Egyptians | 99.9 /100 | #29 | Exceptional 1.9% |
| Immigrants | Nepal | 99.9 /100 | #30 | Exceptional 1.9% |
| Mongolians | 99.9 /100 | #31 | Exceptional 1.9% |
| Luxembourgers | 99.9 /100 | #32 | Exceptional 1.9% |
Demographics Similar to Immigrants from Europe by Vision Disability
In terms of vision disability, the demographic groups most similar to Immigrants from Europe are Immigrants from Croatia (2.1%, a difference of 0.020%), Immigrants from Syria (2.1%, a difference of 0.050%), Immigrants from Somalia (2.1%, a difference of 0.060%), Australian (2.1%, a difference of 0.090%), and Romanian (2.1%, a difference of 0.15%).
| Demographics | Rating | Rank | Vision Disability |
| Immigrants | Moldova | 97.2 /100 | #86 | Exceptional 2.0% |
| Immigrants | Switzerland | 97.0 /100 | #87 | Exceptional 2.0% |
| Norwegians | 97.0 /100 | #88 | Exceptional 2.0% |
| Immigrants | Eastern Africa | 97.0 /100 | #89 | Exceptional 2.0% |
| Immigrants | Lebanon | 96.7 /100 | #90 | Exceptional 2.1% |
| Immigrants | Somalia | 96.2 /100 | #91 | Exceptional 2.1% |
| Immigrants | Syria | 96.2 /100 | #92 | Exceptional 2.1% |
| Immigrants | Europe | 96.1 /100 | #93 | Exceptional 2.1% |
| Immigrants | Croatia | 96.0 /100 | #94 | Exceptional 2.1% |
| Australians | 95.9 /100 | #95 | Exceptional 2.1% |
| Romanians | 95.7 /100 | #96 | Exceptional 2.1% |
| Immigrants | Afghanistan | 95.6 /100 | #97 | Exceptional 2.1% |
| Immigrants | South Africa | 95.4 /100 | #98 | Exceptional 2.1% |
| Estonians | 95.3 /100 | #99 | Exceptional 2.1% |
| Greeks | 95.1 /100 | #100 | Exceptional 2.1% |