Venezuelan vs Immigrants from Europe Vision Disability
COMPARE
Venezuelan
Immigrants from Europe
Vision Disability
Vision Disability Comparison
Venezuelans
Immigrants from Europe
2.1%
VISION DISABILITY
87.2/ 100
METRIC RATING
134th/ 347
METRIC RANK
2.1%
VISION DISABILITY
96.1/ 100
METRIC RATING
93rd/ 347
METRIC RANK
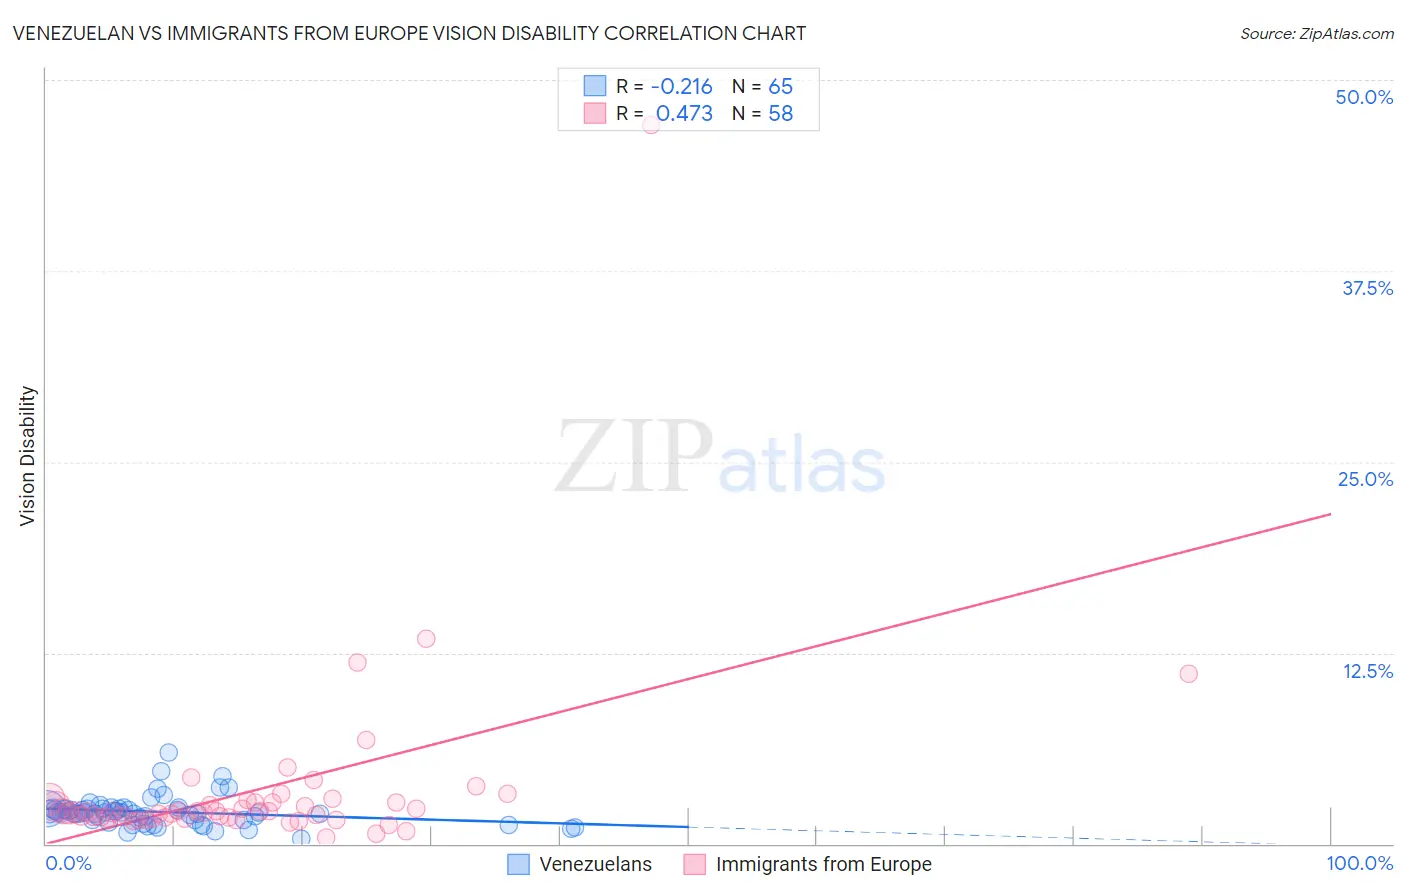
Venezuelan vs Immigrants from Europe Vision Disability Correlation Chart
The statistical analysis conducted on geographies consisting of 306,200,633 people shows a weak negative correlation between the proportion of Venezuelans and percentage of population with vision disability in the United States with a correlation coefficient (R) of -0.216 and weighted average of 2.1%. Similarly, the statistical analysis conducted on geographies consisting of 546,008,895 people shows a moderate positive correlation between the proportion of Immigrants from Europe and percentage of population with vision disability in the United States with a correlation coefficient (R) of 0.473 and weighted average of 2.1%, a difference of 2.1%.
Vision Disability Correlation Summary
| Measurement | Venezuelan | Immigrants from Europe |
| Minimum | 0.36% | 0.41% |
| Maximum | 6.0% | 47.1% |
| Range | 5.6% | 46.7% |
| Mean | 2.1% | 3.5% |
| Median | 2.0% | 2.1% |
| Interquartile 25% (IQ1) | 1.5% | 1.7% |
| Interquartile 75% (IQ3) | 2.3% | 2.7% |
| Interquartile Range (IQR) | 0.73% | 1.0% |
| Standard Deviation (Sample) | 0.94% | 6.3% |
| Standard Deviation (Population) | 0.94% | 6.3% |
Similar Demographics by Vision Disability
Demographics Similar to Venezuelans by Vision Disability
In terms of vision disability, the demographic groups most similar to Venezuelans are Syrian (2.1%, a difference of 0.050%), Vietnamese (2.1%, a difference of 0.070%), Czech (2.1%, a difference of 0.12%), Immigrants from South Eastern Asia (2.1%, a difference of 0.12%), and Arab (2.1%, a difference of 0.13%).
| Demographics | Rating | Rank | Vision Disability |
| Sudanese | 89.2 /100 | #127 | Excellent 2.1% |
| Immigrants | Chile | 89.0 /100 | #128 | Excellent 2.1% |
| Immigrants | Cameroon | 88.8 /100 | #129 | Excellent 2.1% |
| Immigrants | Kenya | 88.7 /100 | #130 | Excellent 2.1% |
| Immigrants | Hungary | 88.7 /100 | #131 | Excellent 2.1% |
| New Zealanders | 88.2 /100 | #132 | Excellent 2.1% |
| Syrians | 87.5 /100 | #133 | Excellent 2.1% |
| Venezuelans | 87.2 /100 | #134 | Excellent 2.1% |
| Vietnamese | 86.7 /100 | #135 | Excellent 2.1% |
| Czechs | 86.3 /100 | #136 | Excellent 2.1% |
| Immigrants | South Eastern Asia | 86.3 /100 | #137 | Excellent 2.1% |
| Arabs | 86.3 /100 | #138 | Excellent 2.1% |
| Immigrants | Morocco | 85.2 /100 | #139 | Excellent 2.1% |
| Immigrants | Netherlands | 84.2 /100 | #140 | Excellent 2.1% |
| Sierra Leoneans | 84.1 /100 | #141 | Excellent 2.1% |
Demographics Similar to Immigrants from Europe by Vision Disability
In terms of vision disability, the demographic groups most similar to Immigrants from Europe are Immigrants from Croatia (2.1%, a difference of 0.020%), Immigrants from Syria (2.1%, a difference of 0.050%), Immigrants from Somalia (2.1%, a difference of 0.060%), Australian (2.1%, a difference of 0.090%), and Romanian (2.1%, a difference of 0.15%).
| Demographics | Rating | Rank | Vision Disability |
| Immigrants | Moldova | 97.2 /100 | #86 | Exceptional 2.0% |
| Immigrants | Switzerland | 97.0 /100 | #87 | Exceptional 2.0% |
| Norwegians | 97.0 /100 | #88 | Exceptional 2.0% |
| Immigrants | Eastern Africa | 97.0 /100 | #89 | Exceptional 2.0% |
| Immigrants | Lebanon | 96.7 /100 | #90 | Exceptional 2.1% |
| Immigrants | Somalia | 96.2 /100 | #91 | Exceptional 2.1% |
| Immigrants | Syria | 96.2 /100 | #92 | Exceptional 2.1% |
| Immigrants | Europe | 96.1 /100 | #93 | Exceptional 2.1% |
| Immigrants | Croatia | 96.0 /100 | #94 | Exceptional 2.1% |
| Australians | 95.9 /100 | #95 | Exceptional 2.1% |
| Romanians | 95.7 /100 | #96 | Exceptional 2.1% |
| Immigrants | Afghanistan | 95.6 /100 | #97 | Exceptional 2.1% |
| Immigrants | South Africa | 95.4 /100 | #98 | Exceptional 2.1% |
| Estonians | 95.3 /100 | #99 | Exceptional 2.1% |
| Greeks | 95.1 /100 | #100 | Exceptional 2.1% |