Dutch vs Immigrants from Europe Currently Married
COMPARE
Dutch
Immigrants from Europe
Currently Married
Currently Married Comparison
Dutch
Immigrants from Europe
49.6%
CURRENTLY MARRIED
99.9/ 100
METRIC RATING
13th/ 347
METRIC RANK
48.1%
CURRENTLY MARRIED
96.9/ 100
METRIC RATING
82nd/ 347
METRIC RANK
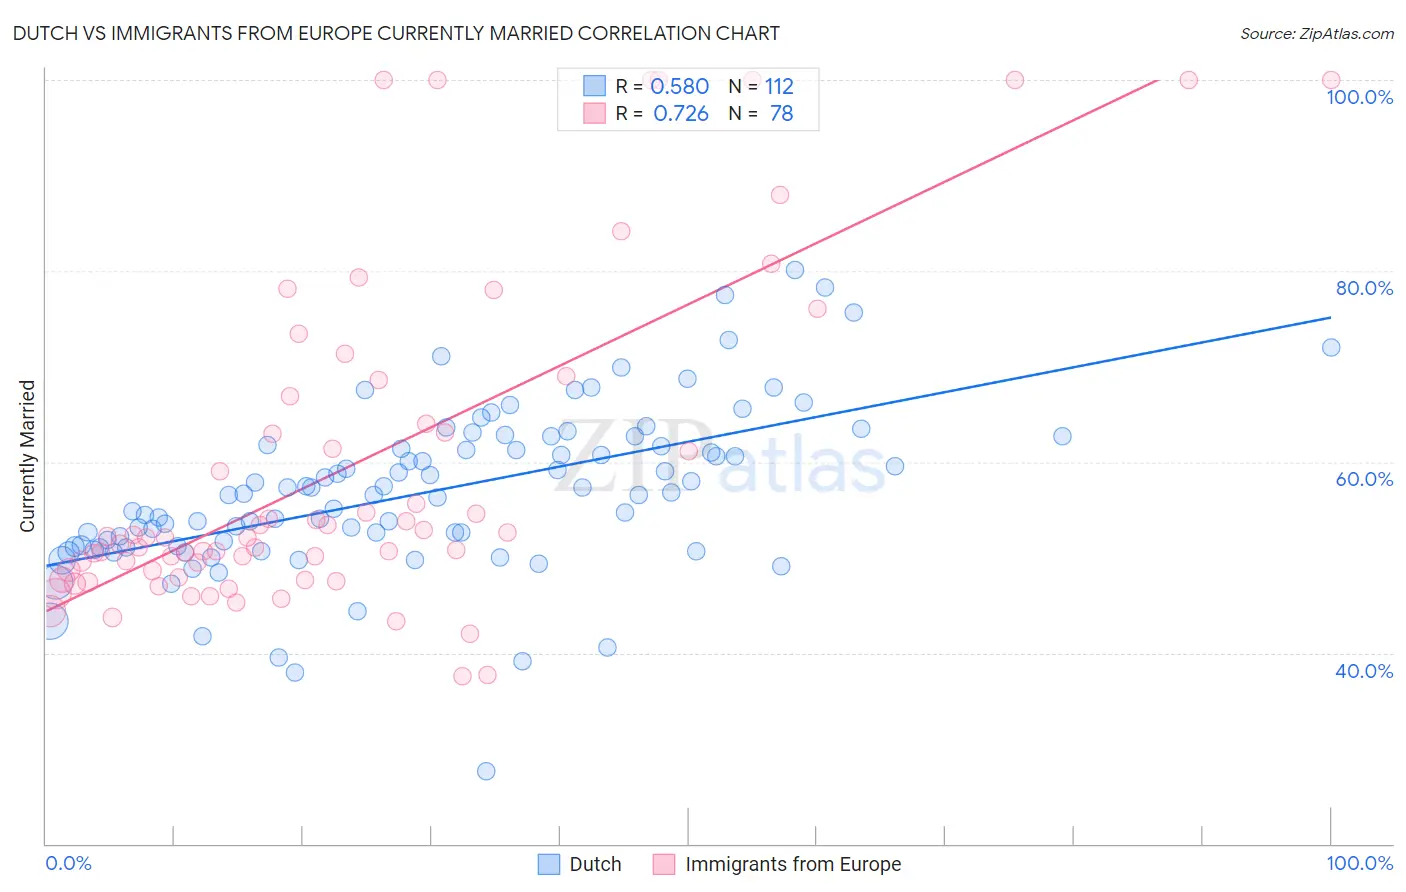
Dutch vs Immigrants from Europe Currently Married Correlation Chart
The statistical analysis conducted on geographies consisting of 554,255,721 people shows a substantial positive correlation between the proportion of Dutch and percentage of population currently married in the United States with a correlation coefficient (R) of 0.580 and weighted average of 49.6%. Similarly, the statistical analysis conducted on geographies consisting of 547,318,007 people shows a strong positive correlation between the proportion of Immigrants from Europe and percentage of population currently married in the United States with a correlation coefficient (R) of 0.726 and weighted average of 48.1%, a difference of 3.1%.
Currently Married Correlation Summary
| Measurement | Dutch | Immigrants from Europe |
| Minimum | 27.6% | 37.5% |
| Maximum | 80.1% | 100.0% |
| Range | 52.5% | 62.5% |
| Mean | 56.8% | 59.6% |
| Median | 56.6% | 52.1% |
| Interquartile 25% (IQ1) | 51.2% | 48.6% |
| Interquartile 75% (IQ3) | 61.7% | 66.9% |
| Interquartile Range (IQR) | 10.6% | 18.3% |
| Standard Deviation (Sample) | 8.6% | 17.4% |
| Standard Deviation (Population) | 8.6% | 17.3% |
Similar Demographics by Currently Married
Demographics Similar to Dutch by Currently Married
In terms of currently married, the demographic groups most similar to Dutch are German (49.6%, a difference of 0.010%), Pennsylvania German (49.6%, a difference of 0.040%), Chinese (49.5%, a difference of 0.18%), Scandinavian (49.5%, a difference of 0.20%), and English (49.7%, a difference of 0.26%).
| Demographics | Rating | Rank | Currently Married |
| Norwegians | 100.0 /100 | #6 | Exceptional 50.2% |
| Immigrants | South Central Asia | 100.0 /100 | #7 | Exceptional 50.0% |
| Swedes | 100.0 /100 | #8 | Exceptional 50.0% |
| Czechs | 99.9 /100 | #9 | Exceptional 49.9% |
| Filipinos | 99.9 /100 | #10 | Exceptional 49.7% |
| English | 99.9 /100 | #11 | Exceptional 49.7% |
| Swiss | 99.9 /100 | #12 | Exceptional 49.7% |
| Dutch | 99.9 /100 | #13 | Exceptional 49.6% |
| Germans | 99.9 /100 | #14 | Exceptional 49.6% |
| Pennsylvania Germans | 99.9 /100 | #15 | Exceptional 49.6% |
| Chinese | 99.9 /100 | #16 | Exceptional 49.5% |
| Scandinavians | 99.9 /100 | #17 | Exceptional 49.5% |
| Immigrants | Scotland | 99.8 /100 | #18 | Exceptional 49.3% |
| Europeans | 99.8 /100 | #19 | Exceptional 49.3% |
| Luxembourgers | 99.8 /100 | #20 | Exceptional 49.3% |
Demographics Similar to Immigrants from Europe by Currently Married
In terms of currently married, the demographic groups most similar to Immigrants from Europe are Immigrants from Sri Lanka (48.1%, a difference of 0.0%), Immigrants from Poland (48.1%, a difference of 0.010%), Bolivian (48.1%, a difference of 0.010%), Immigrants from Israel (48.1%, a difference of 0.010%), and Immigrants from South Africa (48.1%, a difference of 0.040%).
| Demographics | Rating | Rank | Currently Married |
| Immigrants | Belarus | 97.2 /100 | #75 | Exceptional 48.1% |
| Basques | 97.2 /100 | #76 | Exceptional 48.1% |
| Slovenes | 97.1 /100 | #77 | Exceptional 48.1% |
| Immigrants | Belgium | 97.1 /100 | #78 | Exceptional 48.1% |
| Immigrants | South Africa | 97.0 /100 | #79 | Exceptional 48.1% |
| Immigrants | Poland | 96.9 /100 | #80 | Exceptional 48.1% |
| Immigrants | Sri Lanka | 96.9 /100 | #81 | Exceptional 48.1% |
| Immigrants | Europe | 96.9 /100 | #82 | Exceptional 48.1% |
| Bolivians | 96.9 /100 | #83 | Exceptional 48.1% |
| Immigrants | Israel | 96.9 /100 | #84 | Exceptional 48.1% |
| French Canadians | 96.3 /100 | #85 | Exceptional 48.0% |
| Immigrants | Japan | 96.2 /100 | #86 | Exceptional 48.0% |
| Jordanians | 96.2 /100 | #87 | Exceptional 48.0% |
| Immigrants | Eastern Europe | 96.1 /100 | #88 | Exceptional 48.0% |
| Indians (Asian) | 95.8 /100 | #89 | Exceptional 48.0% |