Immigrants from Costa Rica vs British Vision Disability
COMPARE
Immigrants from Costa Rica
British
Vision Disability
Vision Disability Comparison
Immigrants from Costa Rica
British
2.2%
VISION DISABILITY
26.1/ 100
METRIC RATING
190th/ 347
METRIC RANK
2.2%
VISION DISABILITY
25.1/ 100
METRIC RATING
193rd/ 347
METRIC RANK
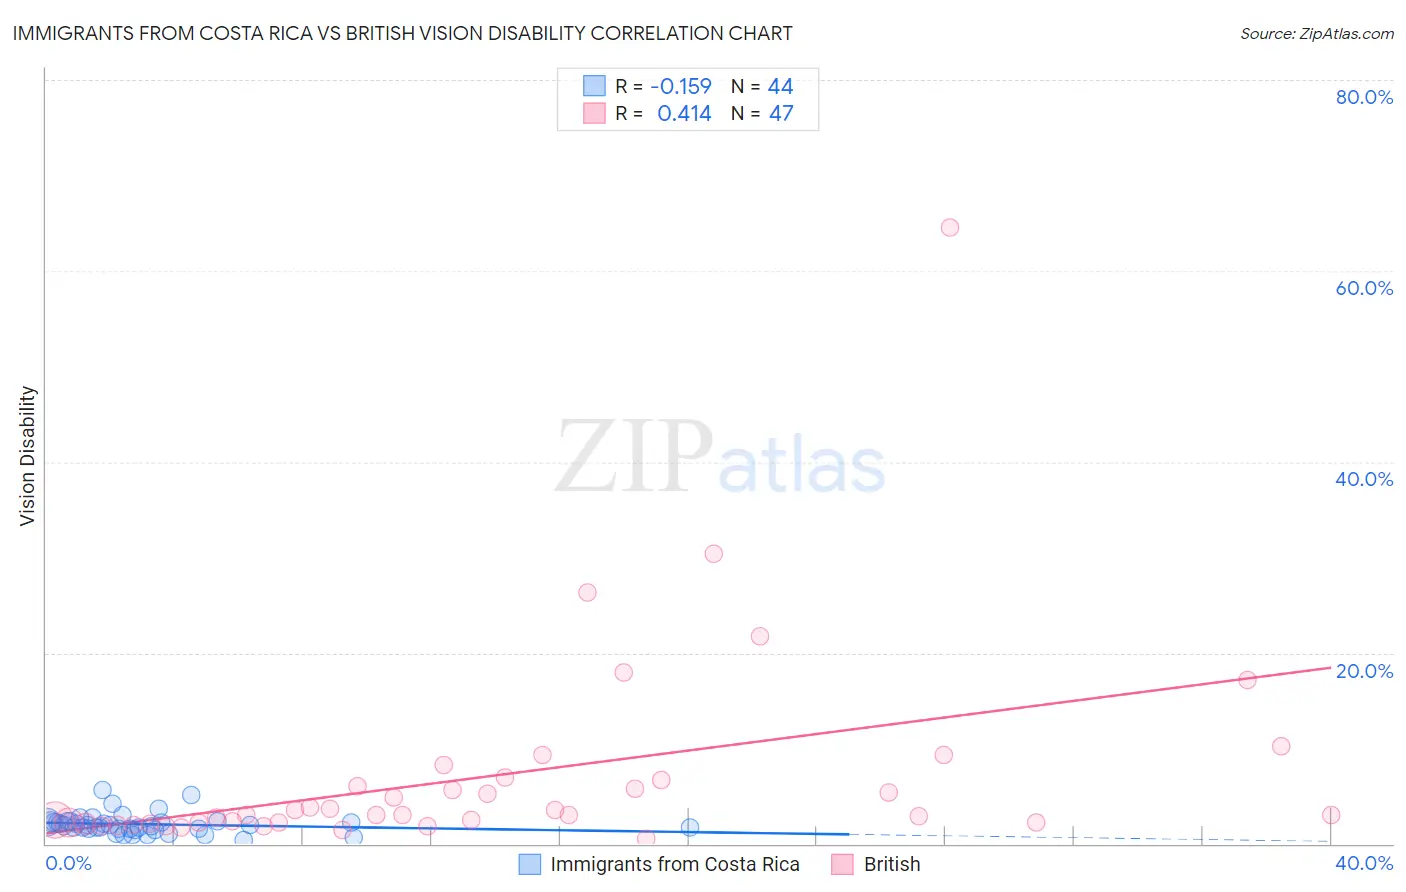
Immigrants from Costa Rica vs British Vision Disability Correlation Chart
The statistical analysis conducted on geographies consisting of 204,228,483 people shows a poor negative correlation between the proportion of Immigrants from Costa Rica and percentage of population with vision disability in the United States with a correlation coefficient (R) of -0.159 and weighted average of 2.2%. Similarly, the statistical analysis conducted on geographies consisting of 530,471,861 people shows a moderate positive correlation between the proportion of British and percentage of population with vision disability in the United States with a correlation coefficient (R) of 0.414 and weighted average of 2.2%, a difference of 0.080%.
Vision Disability Correlation Summary
| Measurement | Immigrants from Costa Rica | British |
| Minimum | 0.38% | 0.53% |
| Maximum | 5.6% | 64.6% |
| Range | 5.3% | 64.1% |
| Mean | 2.0% | 7.1% |
| Median | 1.9% | 3.0% |
| Interquartile 25% (IQ1) | 1.5% | 2.2% |
| Interquartile 75% (IQ3) | 2.3% | 6.6% |
| Interquartile Range (IQR) | 0.75% | 4.5% |
| Standard Deviation (Sample) | 1.0% | 10.8% |
| Standard Deviation (Population) | 1.0% | 10.7% |
Demographics Similar to Immigrants from Costa Rica and British by Vision Disability
In terms of vision disability, the demographic groups most similar to Immigrants from Costa Rica are Canadian (2.2%, a difference of 0.020%), European (2.2%, a difference of 0.030%), Salvadoran (2.2%, a difference of 0.11%), Immigrants from Barbados (2.2%, a difference of 0.17%), and Immigrants (2.2%, a difference of 0.19%). Similarly, the demographic groups most similar to British are European (2.2%, a difference of 0.050%), Canadian (2.2%, a difference of 0.060%), Immigrants from Barbados (2.2%, a difference of 0.090%), Immigrants (2.2%, a difference of 0.11%), and Immigrants from Grenada (2.2%, a difference of 0.17%).
| Demographics | Rating | Rank | Vision Disability |
| Immigrants | Western Europe | 41.1 /100 | #181 | Average 2.2% |
| Costa Ricans | 40.7 /100 | #182 | Average 2.2% |
| Immigrants | Burma/Myanmar | 37.9 /100 | #183 | Fair 2.2% |
| Moroccans | 35.4 /100 | #184 | Fair 2.2% |
| Immigrants | Middle Africa | 33.5 /100 | #185 | Fair 2.2% |
| Native Hawaiians | 33.3 /100 | #186 | Fair 2.2% |
| Immigrants | St. Vincent and the Grenadines | 30.3 /100 | #187 | Fair 2.2% |
| Guyanese | 28.9 /100 | #188 | Fair 2.2% |
| Salvadorans | 27.4 /100 | #189 | Fair 2.2% |
| Immigrants | Costa Rica | 26.1 /100 | #190 | Fair 2.2% |
| Canadians | 25.8 /100 | #191 | Fair 2.2% |
| Europeans | 25.7 /100 | #192 | Fair 2.2% |
| British | 25.1 /100 | #193 | Fair 2.2% |
| Immigrants | Barbados | 24.0 /100 | #194 | Fair 2.2% |
| Immigrants | Immigrants | 23.7 /100 | #195 | Fair 2.2% |
| Immigrants | Grenada | 23.1 /100 | #196 | Fair 2.2% |
| Ghanaians | 21.8 /100 | #197 | Fair 2.2% |
| Czechoslovakians | 21.6 /100 | #198 | Fair 2.2% |
| Immigrants | El Salvador | 21.0 /100 | #199 | Fair 2.2% |
| Immigrants | Thailand | 20.1 /100 | #200 | Fair 2.2% |
| Slovaks | 18.8 /100 | #201 | Poor 2.2% |