Immigrants from Switzerland vs British Vision Disability
COMPARE
Immigrants from Switzerland
British
Vision Disability
Vision Disability Comparison
Immigrants from Switzerland
British
2.0%
VISION DISABILITY
97.0/ 100
METRIC RATING
87th/ 347
METRIC RANK
2.2%
VISION DISABILITY
25.1/ 100
METRIC RATING
193rd/ 347
METRIC RANK
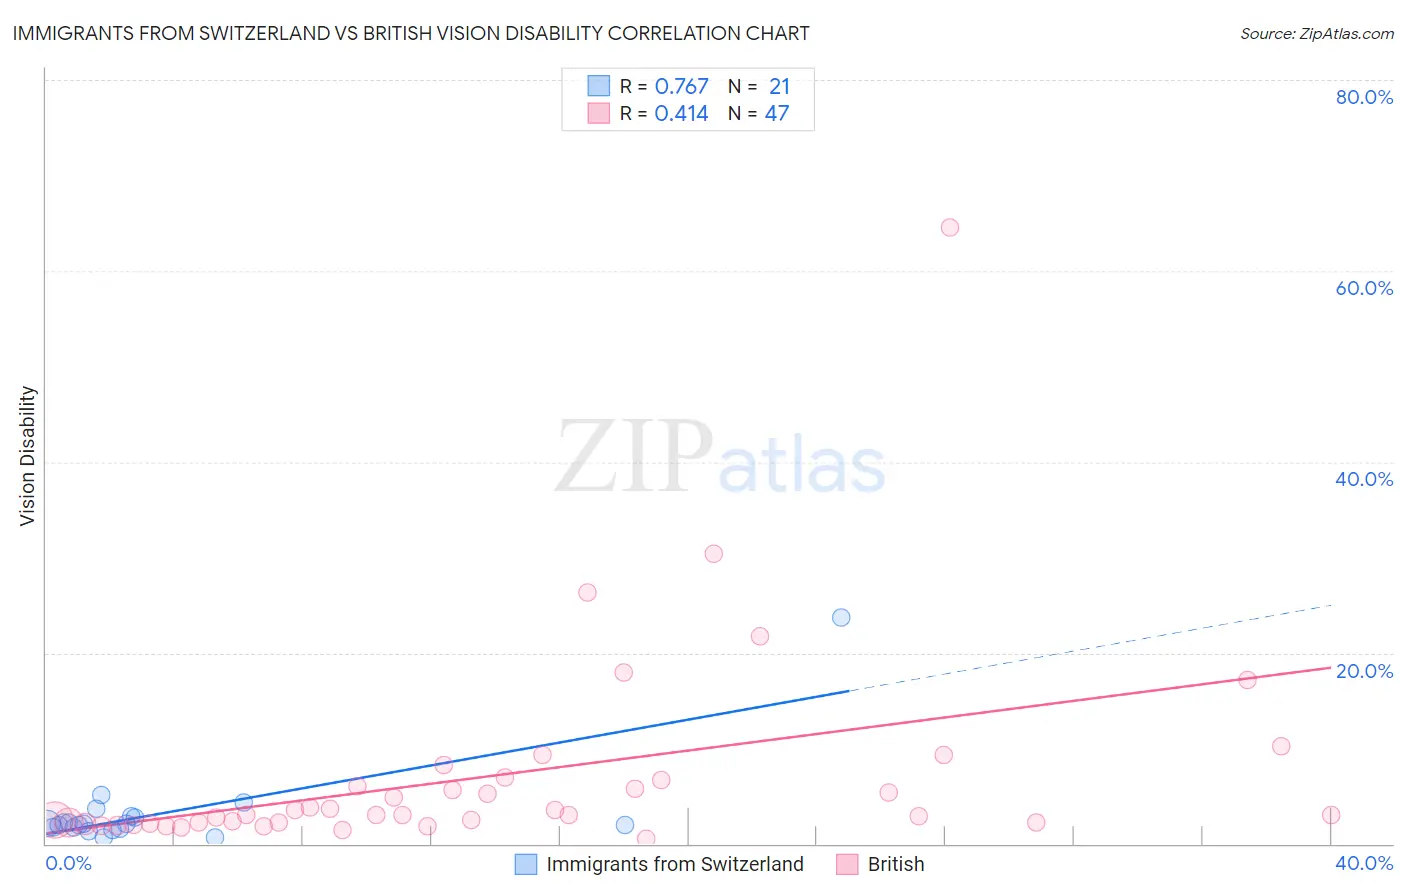
Immigrants from Switzerland vs British Vision Disability Correlation Chart
The statistical analysis conducted on geographies consisting of 148,059,339 people shows a strong positive correlation between the proportion of Immigrants from Switzerland and percentage of population with vision disability in the United States with a correlation coefficient (R) of 0.767 and weighted average of 2.0%. Similarly, the statistical analysis conducted on geographies consisting of 530,471,861 people shows a moderate positive correlation between the proportion of British and percentage of population with vision disability in the United States with a correlation coefficient (R) of 0.414 and weighted average of 2.2%, a difference of 7.6%.
Vision Disability Correlation Summary
| Measurement | Immigrants from Switzerland | British |
| Minimum | 0.59% | 0.53% |
| Maximum | 23.7% | 64.6% |
| Range | 23.1% | 64.1% |
| Mean | 3.2% | 7.1% |
| Median | 2.1% | 3.0% |
| Interquartile 25% (IQ1) | 1.6% | 2.2% |
| Interquartile 75% (IQ3) | 2.8% | 6.6% |
| Interquartile Range (IQR) | 1.2% | 4.5% |
| Standard Deviation (Sample) | 4.8% | 10.8% |
| Standard Deviation (Population) | 4.7% | 10.7% |
Similar Demographics by Vision Disability
Demographics Similar to Immigrants from Switzerland by Vision Disability
In terms of vision disability, the demographic groups most similar to Immigrants from Switzerland are Norwegian (2.0%, a difference of 0.010%), Immigrants from Eastern Africa (2.0%, a difference of 0.050%), Immigrants from Moldova (2.0%, a difference of 0.060%), Chinese (2.0%, a difference of 0.090%), and Immigrants from Latvia (2.0%, a difference of 0.14%).
| Demographics | Rating | Rank | Vision Disability |
| Lithuanians | 97.7 /100 | #80 | Exceptional 2.0% |
| Soviet Union | 97.6 /100 | #81 | Exceptional 2.0% |
| Immigrants | Poland | 97.6 /100 | #82 | Exceptional 2.0% |
| Immigrants | Western Asia | 97.5 /100 | #83 | Exceptional 2.0% |
| Immigrants | Latvia | 97.3 /100 | #84 | Exceptional 2.0% |
| Chinese | 97.2 /100 | #85 | Exceptional 2.0% |
| Immigrants | Moldova | 97.2 /100 | #86 | Exceptional 2.0% |
| Immigrants | Switzerland | 97.0 /100 | #87 | Exceptional 2.0% |
| Norwegians | 97.0 /100 | #88 | Exceptional 2.0% |
| Immigrants | Eastern Africa | 97.0 /100 | #89 | Exceptional 2.0% |
| Immigrants | Lebanon | 96.7 /100 | #90 | Exceptional 2.1% |
| Immigrants | Somalia | 96.2 /100 | #91 | Exceptional 2.1% |
| Immigrants | Syria | 96.2 /100 | #92 | Exceptional 2.1% |
| Immigrants | Europe | 96.1 /100 | #93 | Exceptional 2.1% |
| Immigrants | Croatia | 96.0 /100 | #94 | Exceptional 2.1% |
Demographics Similar to British by Vision Disability
In terms of vision disability, the demographic groups most similar to British are European (2.2%, a difference of 0.050%), Canadian (2.2%, a difference of 0.060%), Immigrants from Costa Rica (2.2%, a difference of 0.080%), Immigrants from Barbados (2.2%, a difference of 0.090%), and Immigrants (2.2%, a difference of 0.11%).
| Demographics | Rating | Rank | Vision Disability |
| Native Hawaiians | 33.3 /100 | #186 | Fair 2.2% |
| Immigrants | St. Vincent and the Grenadines | 30.3 /100 | #187 | Fair 2.2% |
| Guyanese | 28.9 /100 | #188 | Fair 2.2% |
| Salvadorans | 27.4 /100 | #189 | Fair 2.2% |
| Immigrants | Costa Rica | 26.1 /100 | #190 | Fair 2.2% |
| Canadians | 25.8 /100 | #191 | Fair 2.2% |
| Europeans | 25.7 /100 | #192 | Fair 2.2% |
| British | 25.1 /100 | #193 | Fair 2.2% |
| Immigrants | Barbados | 24.0 /100 | #194 | Fair 2.2% |
| Immigrants | Immigrants | 23.7 /100 | #195 | Fair 2.2% |
| Immigrants | Grenada | 23.1 /100 | #196 | Fair 2.2% |
| Ghanaians | 21.8 /100 | #197 | Fair 2.2% |
| Czechoslovakians | 21.6 /100 | #198 | Fair 2.2% |
| Immigrants | El Salvador | 21.0 /100 | #199 | Fair 2.2% |
| Immigrants | Thailand | 20.1 /100 | #200 | Fair 2.2% |